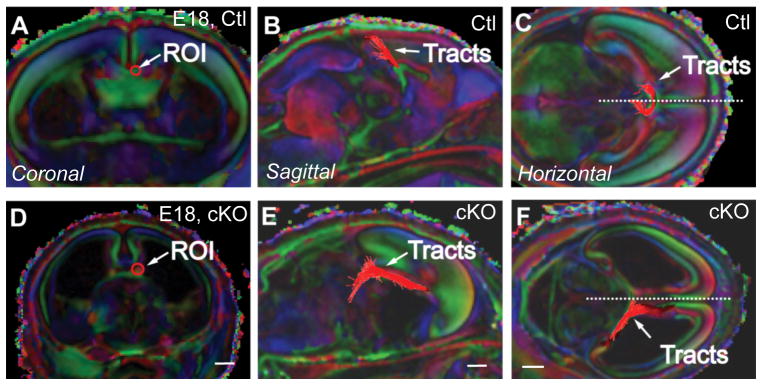
Figure 9.
DTMRI tractography in E18 brains of Emx1-cre;Fgf8flox/flox mice (cKO). From a region of interest (ROI) in the corpus callosum (A-F), tractography in mutants shows profound misprojections that fail to cross the midline (hatched line) compared to wildtype littermates (Ctl). Probst bundles are apparent from an ROI in the corpus callosum (E and F). Tractography was performed with DTI-Studio (tracking thresholds: angle <70 degrees, FA>0.3). Scale bar A, D = 0.7 mm; B, E = 0.8 mm; C, F = 1 mm.

