Fig 1.
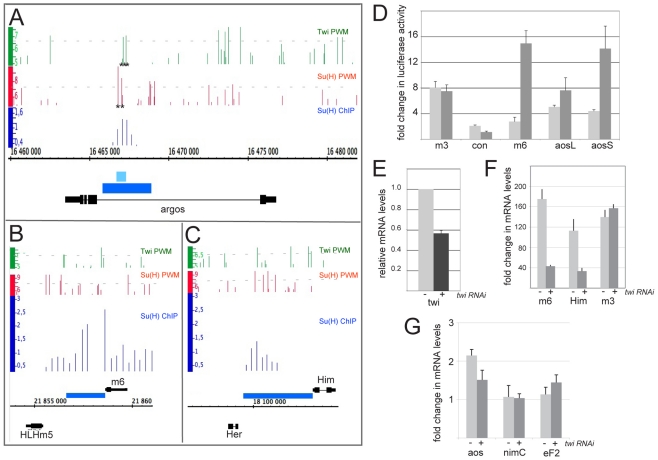
Requirement for Twist at Notch target enhancers. (A-C) Genomic regions surrounding Drosophila E(spl)m6 (B), Him (C) and aos (A). Black lines and boxes (exons) represent transcribed regions. Graphs show matches to Twi PWM (green bars; Patser score 5-9.3), Su(H) PWM (red bars; Patser score 5-9.79) or the region enriched in ChIP experiments by Su(H) (blue bars; enrichment relative to input; log2 0.3-2.3). Blue rectangles represent regions cloned to create reporters used in subsequent experiments. Asterisks (A) represent binding sites that have been mutated in subsequent experiments. Light-blue rectangle represents fragment aosS, the dark-blue rectangle fragment aosL. Note that aosS contains all Su(H) sites and two of the three Twi sites, aosL=aosNRE and contains additional Su(H) sites. (D) Response of the indicated enhancers to NICD in transient transfection assays in S2 cells (light-grey bars) or DmD8 cells (dark-grey bars). (E-G) twi RNAi treatment of DmD8 cells. (E) Efficiency of twi RNAi treatment on twi levels in DmD8 cells. Values in control untreated cells are normalised to 1. (F,G) Fold change in the expression levels of the indicated genes after Notch activation, as determined by quantitative RT-PCR in the absence (light grey) or presence (dark grey) of twi RNAi. The average of three biological replicates is shown; the data are plotted on separate graphs because of the difference in magnitude of the fold stimulation by Notch. (F) E(spl)m6 and Him, which show 175-fold and 113-fold stimulation by Notch, respectively, are reduced by 76% and 79%, respectively, by twi RNAi, whereas the 140-fold stimulation of E(spl)m3 is not reduced by twi RNAi. (G) The 2-fold stimulation of aos by Notch showed a 56% reduction in the presence of twi RNAi. Control genes (nimC1 and Ef2) were neither induced by Notch nor reduced by twi RNAi. Expression levels in F and G were normalised to that of rp49 (RpL32). Error bars are s.e.m.

