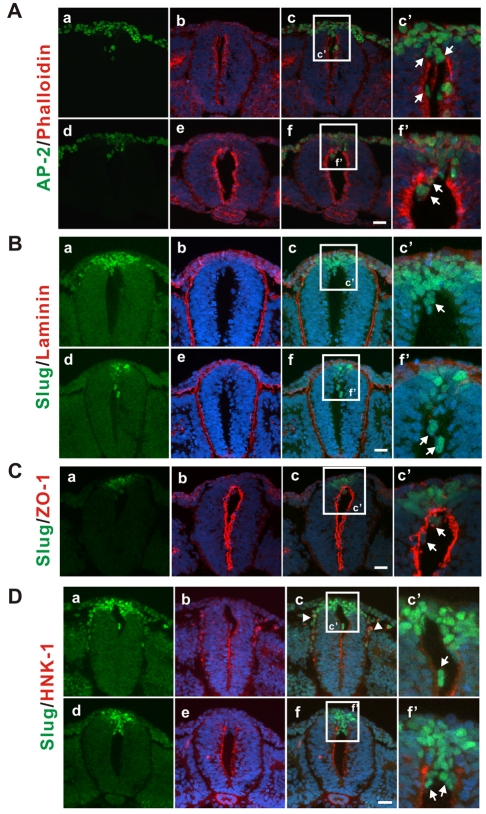
Fig. 4.
Ectopic collagen allows premature migration of the pre-migratory neural crest cells into the lumen of the neural tube. Type I collagen was injected into the lumen of the neural tube of 11-14 ss embryos and the embryos were incubated for 7-9 hours before fixation. (A) AP-2 (green)-positive cells enter the lumen of neural tube at the axial level where both migratory and pre-migratory neural crest cells normally exist (a-c) and at the axial level, which has only pre-migratory neural crest cells (the segmental plate, d-f). Arrows (c',f') indicate AP-2-positive cells in the lumen. Phalloidin stains actin (red). The most representative images are shown (at least three random sections per embryo and at least seven embryos were analyzed). (B) Slug (green)-expressing cells enter the lumen of neural tube at the axial levels where there are only pre-migratory neural crest cells (between the three last formed somite pairs, d-f) and at axial levels where both migratory and pre-migratory neural crest cells are found (a-c). Arrows (c',f') indicate Slug-positive cells in the lumen. Red staining is for laminin. The most representative images are shown (at least three random sections per embryo and at least 10 embryos were analyzed). (C) Slug (green)-positive cells residing in the lumen (arrows in c') have nonpolarized distribution of ZO-1 (red), which normally demarcates the apical-lumenal boundary. The most representative images are shown (at least three random sections per embryo and at least five embryos were analyzed). (D) Slug-positive cells inside of the lumen do not express HNK-1 (c',f', arrows). This is the case both at axial levels that do not have endogenous migratory neural crest (between the three last formed somite pairs, d,e,f,f') and at axial levels with endogenous migratory neural crest (a,b,c,c'). By contrast, the endogenous migratory neural crest cells express both Slug (green) and HNK-1 (red) (a-c; arrowheads). The most representative images are shown (at least three random sections per each embryo and at least eight embryos were analyzed). For all samples, blue is DRAQ5 nuclear staining and the white boxed regions in c and f are magnified in c' and f', respectively. Scale bars: 25 μm.

