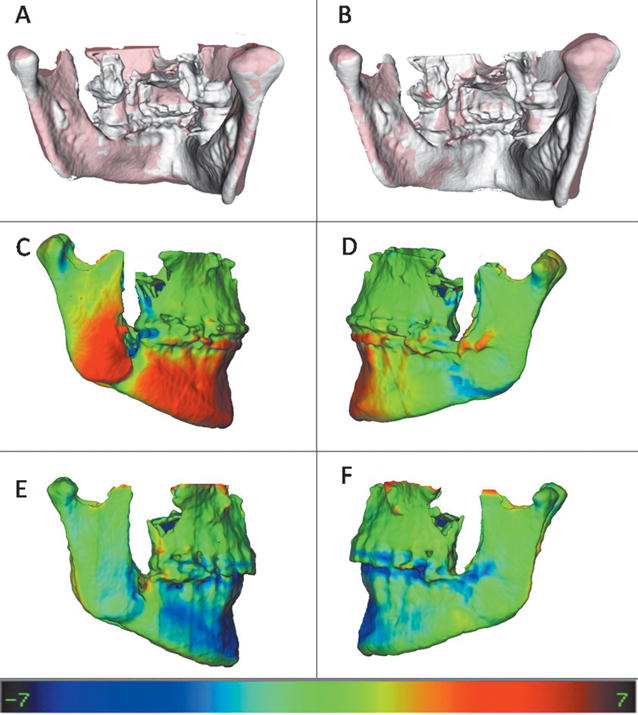
Fig 6.

Example of a patient who had asymmetrical torque of the mandible with surgery; this torque remained stable at the 1-year follow-up, but the chin advancement relapsed slightly. A and B, Semi-transparency visualizations of lateral displacements of the inferior portion of the rami with surgery: A, presurgery is shown (white), and splint-removal model is semitransparent (red) and maintained after 1 year; B, presurgery is shown (white), and 1-year follow-up is semitransparent (red). The torque change was greater on the right side than on the left. C and D, Color maps of the splint-removal model showing the surface distances between presurgery and splint removal. These maps show that the inferior portion of the right side moved laterally (C) much more than the left side (D) with surgery, with marked chin advancement of 7 mm. E and F, Color maps of the 1-year follow-up model showing the surface distances between splint removal and the 1-year follow-up. These maps show that postsurgical adaptations in the ramus were almost zero (green), but some relapse occurred in the chin advancement (blue). Color map ranges between −7.0 mm (dark blue) and +7.0 mm (dark red).
