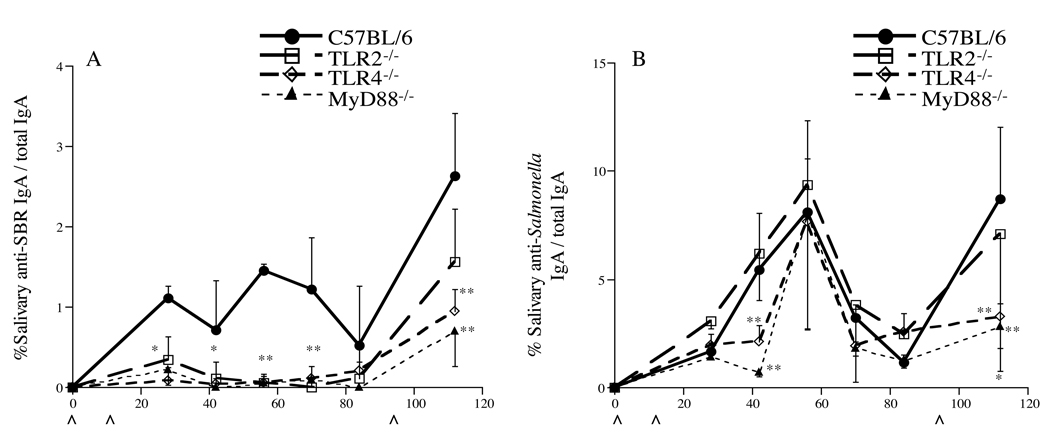
Fig. 4.
% specific IgA antibody/total IgA antibody level to SBR (A) and to Salmonella (B). Immunization procedure is as described in legend to Figure 1. The results are expressed as the means of the % specific IgA antibody/total IgA antibody ×/÷ SD. Values were significantly different from those of wt mice at P < 0.05 (*) and P < 0.005 (**). ^ Indicates time of immunization.

