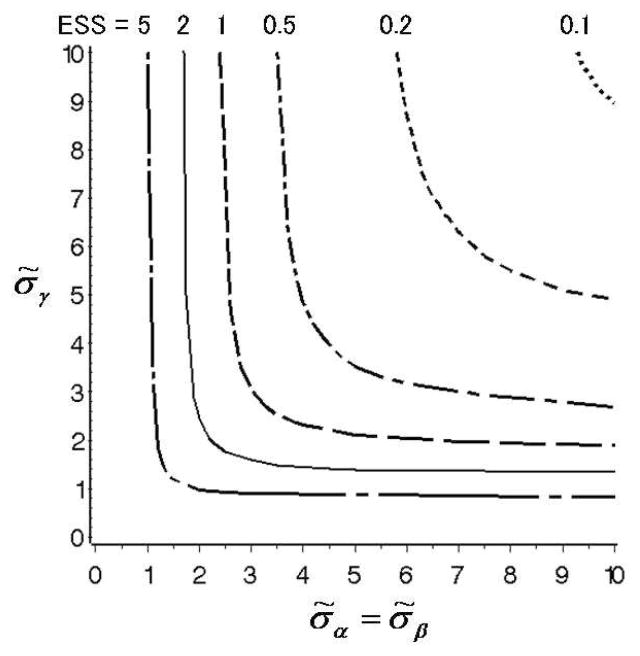
Fig. 1.
Contour plots of ESS values for σ̃α = σ̃β (x-axis) and σ̃γ (y-axis), obtained in Example 1 ([1]). Dotted, dashed, dashed-dotted, longer dashed, solid, longer dashed-dotted lines show the plots of ESS = 0.1, 0.2, 0.5, 1.0, 2.0, and 5.0, respectively.

