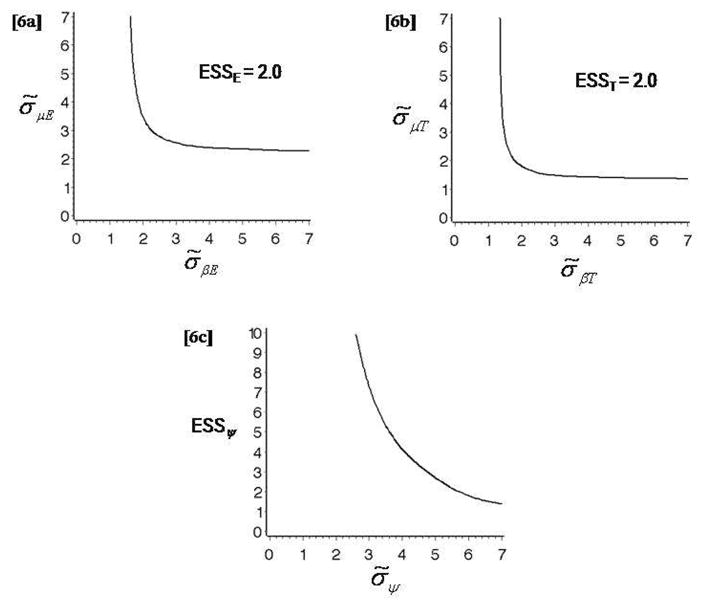
Fig. 6.

(a) Contour plot of ESSE = 2.0, fixing (σ̃μT, σ̃βT, σ̃ψ) = (0.941, 1.659, 1). (b) Contour plot of ESST = 2.0, fixing (σ̃μE, σ̃βE, σ̃ψ) = (2.68, 2.68, 3.16). (c) Plot of ESSψ values against σ̃ψ, fixing σ̃μE, σ̃βE, σ̃μT, σ̃βT = (2.68, 2.68, 1.89, 1.89). The three plots are obtained in Example 6 (Thall and Cook [10]).
