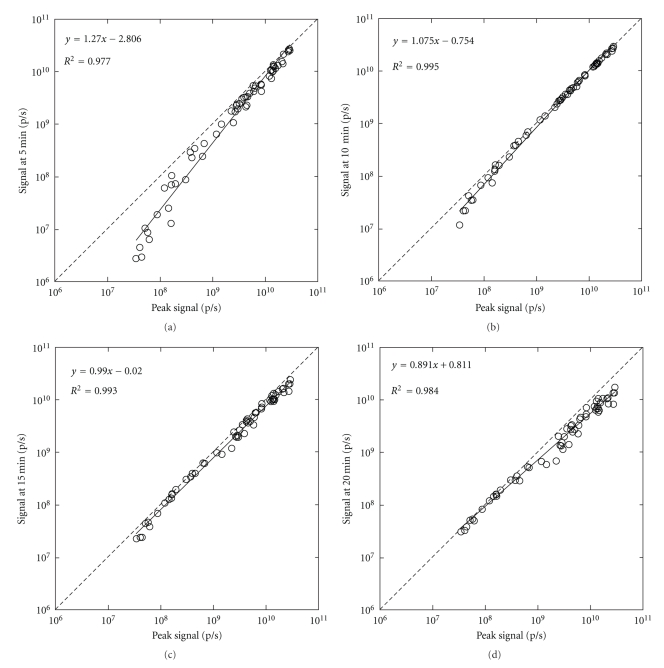
Figure 5.
Correlation of the signals at various time points after d-luciferin injection with the peak signal. The signals are presented on a logarithmic scale. The solid and broken lines represent the regression line and the line of identity, respectively. Linear regression was performed after logarithmic transformation.

