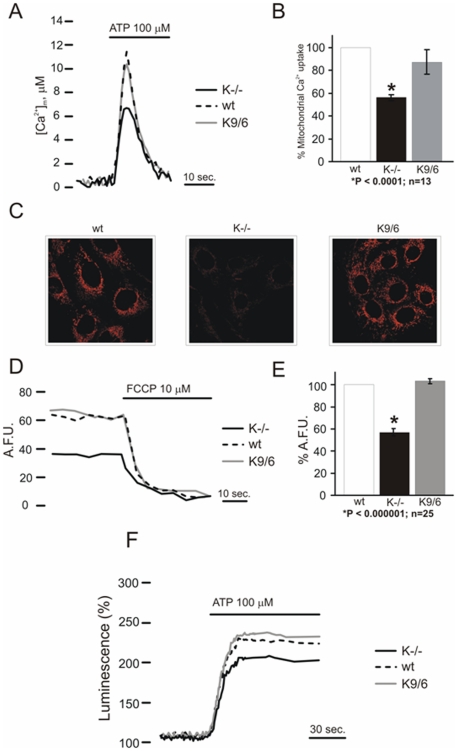
Figure 11. Krit1 regulates mitochondrial homeostasis.
A) Wild-type (WT), KRIT1−/− (K−/−) and KRIT1-transduced (K9/6) MEFs grown under standard conditions were infected with the adenovirus expressing the mtAEQ chimera. After 36 h of expression cells were measured as described in Material and Methods. Where indicated, the cells were stimulated with 100 µM ATP. The traces shown are representative of the kinetic of mitochondrial Ca2+ responses. B) [Ca2+]m responses is represented as a percentage of the peak value of control cells. C) TMRM staining after 30 minutes loading at 37°C, as described in Materials and Methods. K−/− cells showed a significant lower intensity fluorescent signal than WT and K9/6 MEFs clearly indicating a reduced mitochondrial membrane potential (Δψ). D) Kinetics of tetramethyl rhodamine methyl ester (TMRM) fluorescence of WT, K−/− and K9/6 MEFs. FCCP (carbonyl cyanide p-trifluoromethoxyphenylhydrazone), an uncoupler of oxidative phosphorylation, completely collapses the Δψ. The traces are representative of single cell responses. E) Average variations of TMRM fluorescence of WT, K−/− and K9/6 MEFs treated with FCCP as calculated for six independent experiments and represented as a percentage of the value of WT cells. F) WT, K−/− and K9/6 MEFs were infected with the adenovirus expressing the mtLUC chimera. The traces show mitochondrial ATP concentration ([ATP]m) changes elicited by mitochondrial Ca2+ increase in cells perfused with 100 µM ATP as agonist. mtLuc luminescence data are expressed as a percentage of the initial value. The traces are representative of n = 12 from three independent experiments.

