
Figure 11.
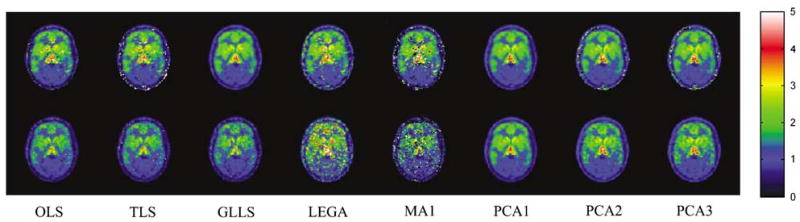
DVR images from a representative control subject estimated from data obtained before and after 40 mins with no intervention. The OLS, TLS, and GLLS show a decrease in global DVR values despite there being no intervention. Likelihood estimation graphical analysis and MA1 give very noisy results. Principal component analysis 1 yields images with high precision for both ‘pre-’ and ‘post’ estimation periods with no noticeable difference in binding magnitudes between the two estimations.