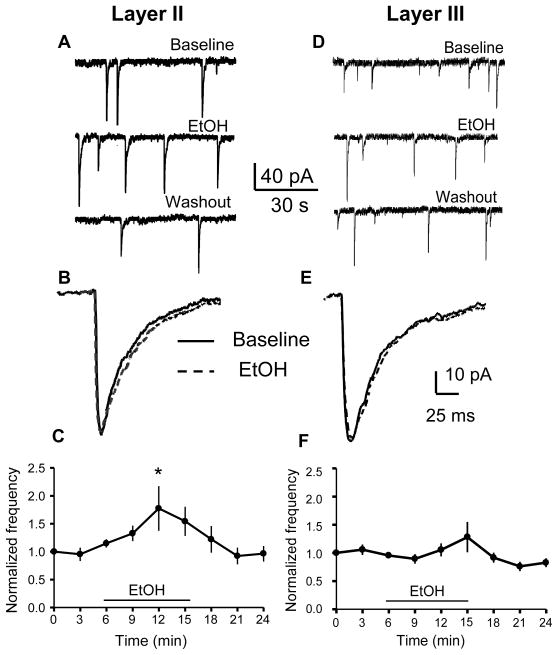
Figure 2. Effect of EtOH on GABAA-sPSC frequency in layer II and layer III pyramidal neurons.
(A, D) Sample GABAA-sPSC traces obtained before, during, and after washout of 70 mM EtOH. (B, E) Average GABAA-sPSC traces obtained before (solid line) and after 70 mM EtOH application (dashed line). (C, F) Timecourse of EtOH’s effect on GABAA-sPSC frequency (* p < 0.05, one-way ANOVA followed by Dunnett post-hoc test vs. the 3 min time point; n=8 cells). Data were normalized with respect to an average of responses obtained in the first 3 min of recording.

