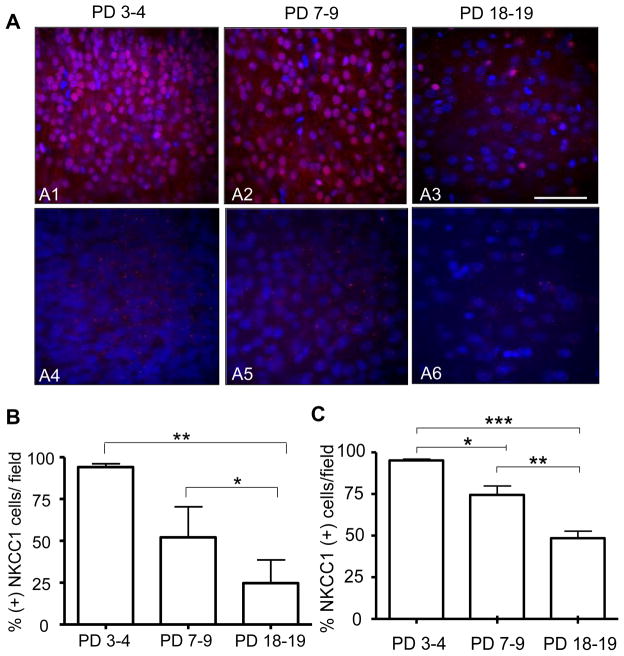
Figure 6. Protein and intranuclear mRNA expression of the NKCC1 co-transporter at three developmental stages in layer II/III of the neocortex.
(A1 – A3) 40× confocal images of immunohistochemical experiments performed with an anti-NKCC1 antibody (red) and the nuclear stain, DAPI (blue) (Scale bar 10 μm). (A4–A6) 40× confocal images of FISH assays that were performed with a NKCC1 specific mRNA riboprobe (red) and the nuclear stain, DAPI (blue) (B) Percent of cells that were positive for NKCC1 protein per field as a function of developmental stage (n= 6 animals per age group, ** p< 0.01, * p< 0.05 by repeated measures one-way ANOVA followed by Tukeys post-hoc test). (C) Percent of cells that were positive for NKCC1 mRNA foci per field as a function of developmental stage (n= 6 animals per age group, *** p< 0.001, ** p< 0.01, * p< 0.05 by repeated measures one-way ANOVA followed by Tukeys post-hoc test).

