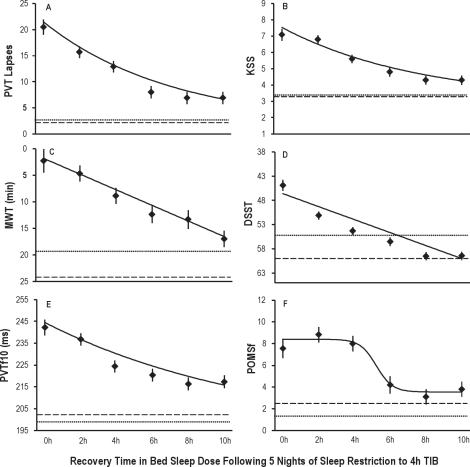
Figure 3.
Neurobehavioral outcomes as a function of increasing TIB dose (0 h-10 h) following the acute recovery (REC) night. N = 142 sleep restricted subjects were randomized to either 0 h TIB (n = 13), 2 h TIB (n = 27), 4 h TIB (n = 29), 6 h TIB (n = 25), 8 h TIB (n = 21), or 10 h TIB (n = 27). Least squares means (± SEM) are shown as diamonds for each REC sleep dose subgroup, controlling for covariates (i.e., baseline, cumulative deficits during sleep restriction, age, and sex). For comparison, horizontal dotted lines show baseline night (B2, 10 h TIB) values, and horizontal dashed lines show control group (N = 17) means on day 8 (10 h TIB), which is the day equivalent to REC. All neurobehavioral outcomes showed improvement as recovery sleep doses increased (graph A, PVT lapses decreased, P < 0.0001; B, KSS sleepiness decreased, P < 0.0001; C, MWT latencies increased, P < 0.0001; D, DSST number correct increased, P < 0.0001; E, PVT fastest RTs shortened, P < 0.0001; F, POMS fatigue decreased, P < 0.0001). Best-fitting recovery sleep dose-response functions (from AIC) are shown as the solid lines in each graph (see Supplement Tables S2 to S8). These functions are exponential with asymptote set to baseline (graphs A, B, E), linear (graphs C, D) and sigmoidal (graph F). Least squares means (diamonds) represent the overall covariate-controlled group means; best-fitting functions are shown for males with the other covariates set to the sample means.

