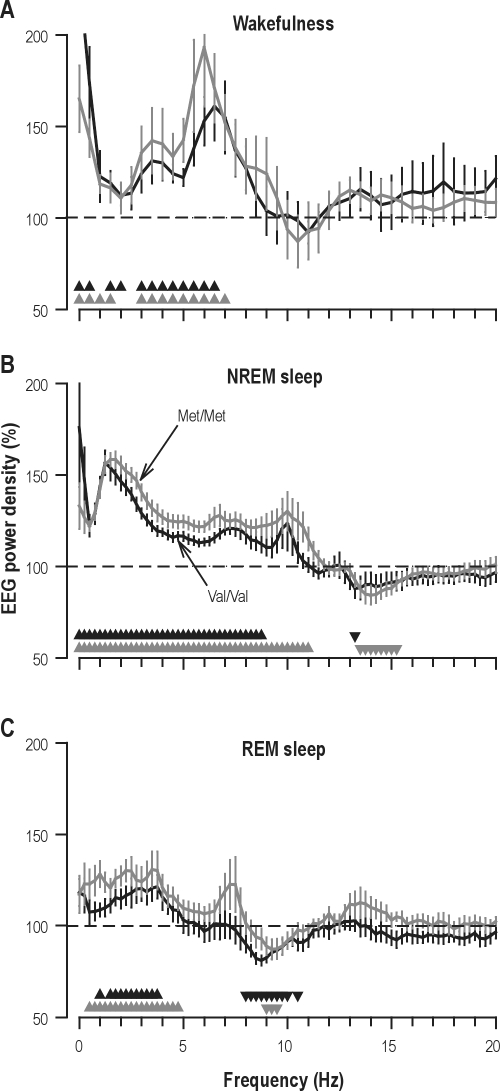
Figure 2.
Sleep deprivation affects EEG similarly in Val/Val (n = 10, black lines) and Met/Met (n = 12, gray lines) homozygotes of the Val158Met polymorphism of COMT. EEG power density (C3A2 derivation) in (A) wakefulness, (B) NREM sleep (stages 2-4), and (C) REM sleep in the placebo condition. Absolute power values in each frequency bin after sleep deprivation were expressed as percentage of the corresponding value in baseline (horizontal dashed line at 100%). To quantify the effects on the waking EEG, power values in the recording sessions at 11:00, 14:00, and 17:00 on day 2 of sleep deprivation were expressed as a percentage of the corresponding values of day 1. Means ± SEM are plotted for each 0.5 Hz bin in waking and for each 0.25 Hz bin in NREM and REM sleep. Black and gray triangles denote significant differences from baseline in Val/Val and Met/Met genotypes, respectively (P < 0.05, paired 2-tailed t-tests).

