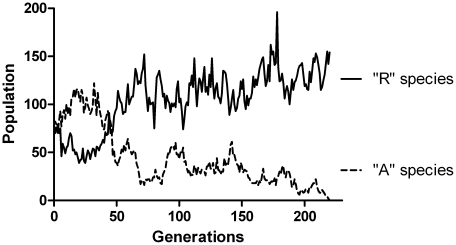
Figure 1. Trajectory of the populations of two species in the stochastic selection model.
The species “R” (solid line) and “A” (dashed line) were actually identical because the risk-reward r was set to 1. Both species had a baseline fecundity g 0 = 2, i.e. in the absence of risk and competition, each organism would produce a mean of 2 offspring. The population ceiling parameter nmax was set to 150. The model was run until one species (“A”) became extinct, after 220 generations.

