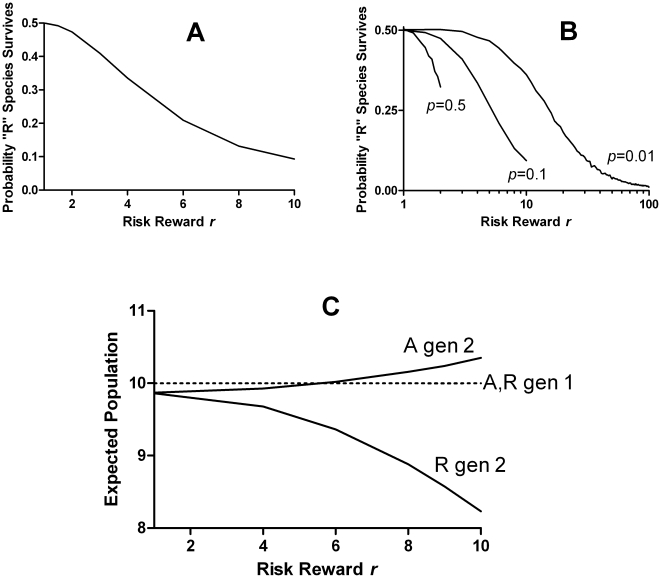
Figure 2. Intrinsic selection against risk-taking species.
A. The fraction of 10,000 trials in which the “R” species survived the selection, as a function of the risk-reward r. The probability p of the risk event was kept constant at 0.1, and nmax at 150 Higher values of r indicate a higher reproductive advantage for the 10% of “R” organisms that “win” the risk event, but also a correspondingly greater penalty for the 90% that lose, so that the overall expected fecundity remains at 2. When r = 1/p, the losers leave no descendants. B. Similar to A, but showing different values of the long-shot probability p. C. Analytically computed expectation values of the populations of “R” and “A” organisms after 1 or 2 generations, starting from 10 of each, with the deterministic saturation population size set to 20 and p = 0.1. The effect of risk to depress the expected “R” population appears only in the second generation, due to correlation between fecundity fluctuations in the first generation and population competition in the second. Note that even when r = 1 both populations are slightly depressed due to the effect of Poisson fluctuations in individual fecundity.

