
Figure 1.
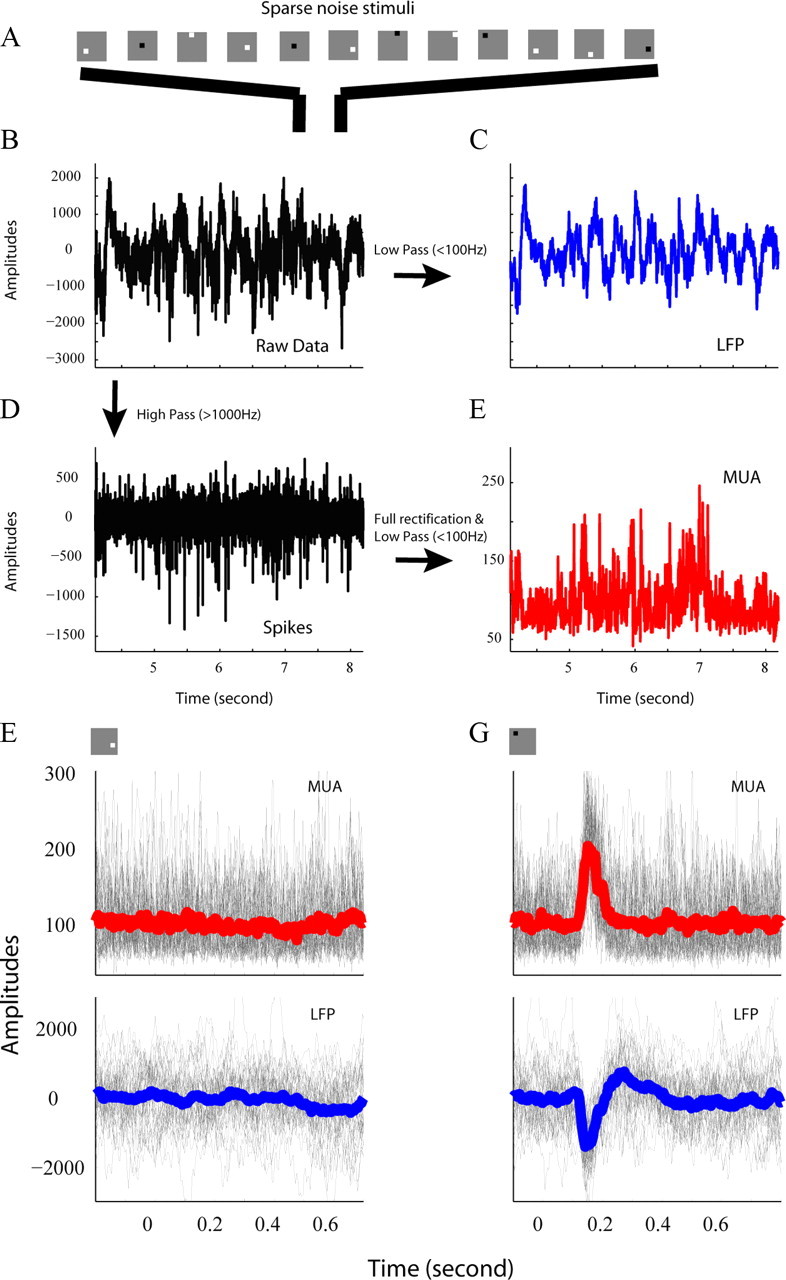
Cross-correlation between sparse noise stimuli and LFP/MUA signals. A, Each individual image in a sequence of randomly positioned (in a 12 × 12 sample grid) dark and bright squares (0.2° × 0.2°) appeared for 40 or 50 ms against a gray background. B, Unfiltered continuous signal recorded by Thomas 7-electrode system. C, Unfiltered signal in B was low-pass (100 Hz) filtered into LFP. D, High-pass-filtered (1000 Hz) raw signal contains spikes from individual neurons. E, High-passed (1000 Hz) signal then was full-wave rectified and low-pass filtered at 100 Hz, and the result was defined as MUA. F, G, LFP (top) and MUA (bottom) signals following each square type (different location and contrast polarity) were aligned by the onset of that stimulus (gray curves in F and G). Red curves in F and G are averaged traces of all MUA signals. Blue curves in F and G are averaged trace of all LFP signals.