
Figure 3.
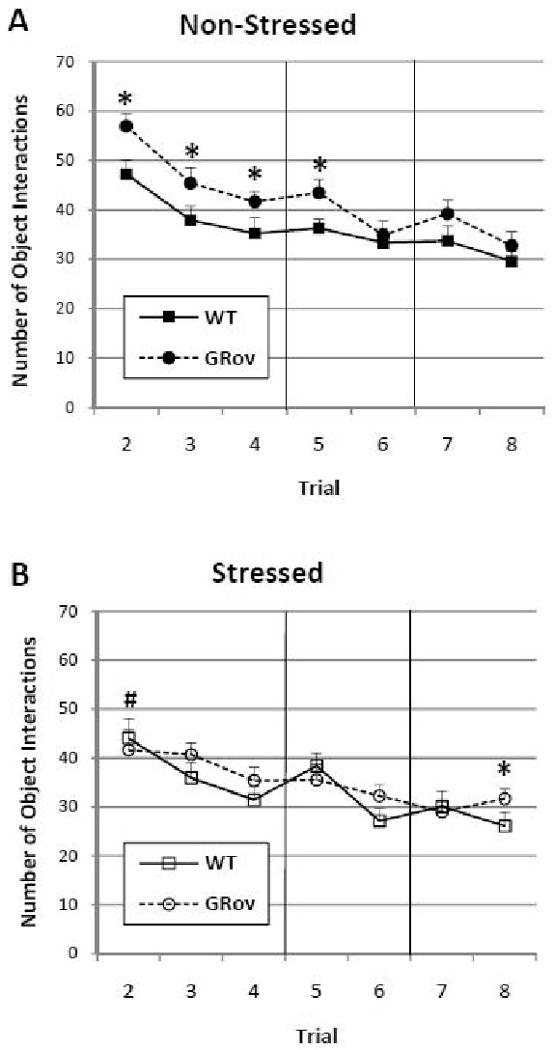
Number of interactions with all objects over the course of the multi-trial experiment for non-stressed (A) and stressed (B) mice. Trials 2-4: Habituation trials; Trials 5-6: Spatial novelty trials; Trials 7-8: Object novelty trials. Each point represents the mean ± SEM. Squares and circles represent WT and GRov mice, respectively. (*, P < 0.05 GRov vs. WT; #, P < 0.05 non-stressed GRov vs. stressed GRov).