
Figure 5.
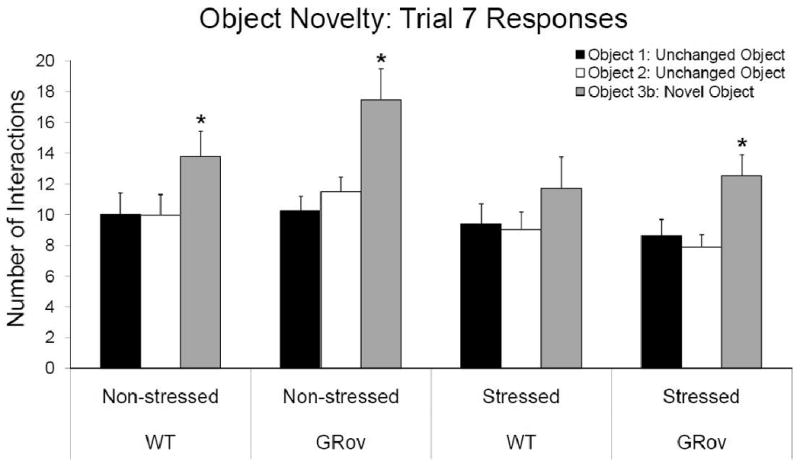
Discrimination of object novelty as displayed by the number of interactions with each object in Trial 7. Each bar represents the mean + SEM. (*, P < 0.05 preference for novel object).
Official websites use .gov
A
.gov website belongs to an official
government organization in the United States.
Secure .gov websites use HTTPS
A lock (
) or https:// means you've safely
connected to the .gov website. Share sensitive
information only on official, secure websites.
Discrimination of object novelty as displayed by the number of interactions with each object in Trial 7. Each bar represents the mean + SEM. (*, P < 0.05 preference for novel object).