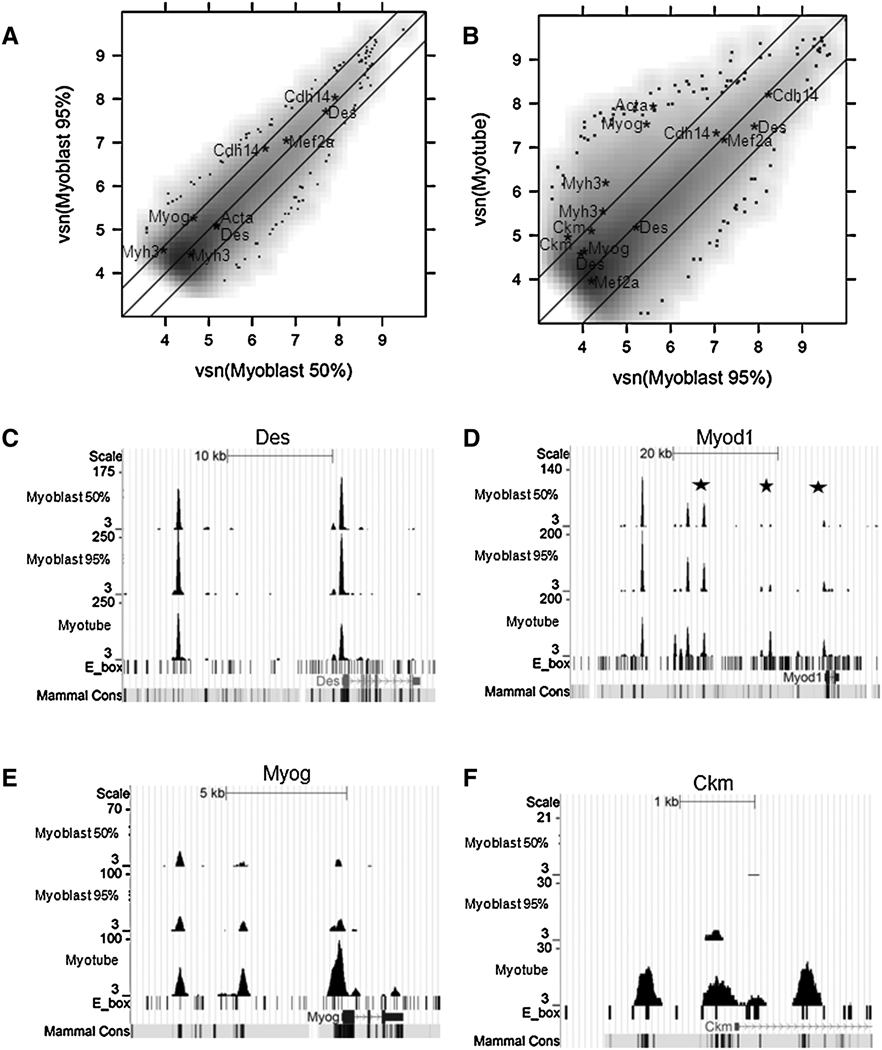
Figure 2.
MyoD binding in C2C12 myoblasts compared to C2C12 myotubes. A) 50% and 95% confluent C2C12 myoblasts share similar binding profiles. The X- and Y-axes of the scatter plot correspond to the Variance Stabilization and Normalization (vsn) transformed number of reads in 50% and 95% confluent C2C12 myoblasts in the combined peak regions. The middle diagonal line is the linear fit. The two flanking lines define the 95% confidence interval for differential peaks. Grey scale values represent a smoothed density estimate for the bulk of the data. Individual points shown at the fringes represent the outliers in low density regions. Peaks within +/−2 kb of the TSS of selected muscle genes (Myh3, Acta, Myog, Cdh14, Mef2a, Des, and Ckm) are annotated by gene names. Note that some genes have multiple peaks within the promoter regions. B) 95% C2C12 myoblasts and C2C12 myotubes have overlapping but different binding profiles. Scatter plot is similar to Figure 2A. C)) MyoD binding profile at the Desmin locus. The Y-axis scale was adjusted by the total number of reads in each cell type, so that non-differentially bound peaks appear roughly the same heights in all three tracks. The two peaks match the two previously characterized MyoD binding sites (Tam et al., 2006). D) MyoD binding profile at the MyoD locus identifies three previously characterized MyoD binding sites (stars) (Asakura et al., 1995; Goldhamer et al., 1992; Tapscott et al., 1992) and several new MyoD binding sites. E) MyoD binding profile at the Myog locus identifies the known MyoD binding site in the promoter region, as well as a new binding site at the 3’ end of the gene. F) MyoD binding profile at the Ckm Locus identifies all known MyoD binding sites.

