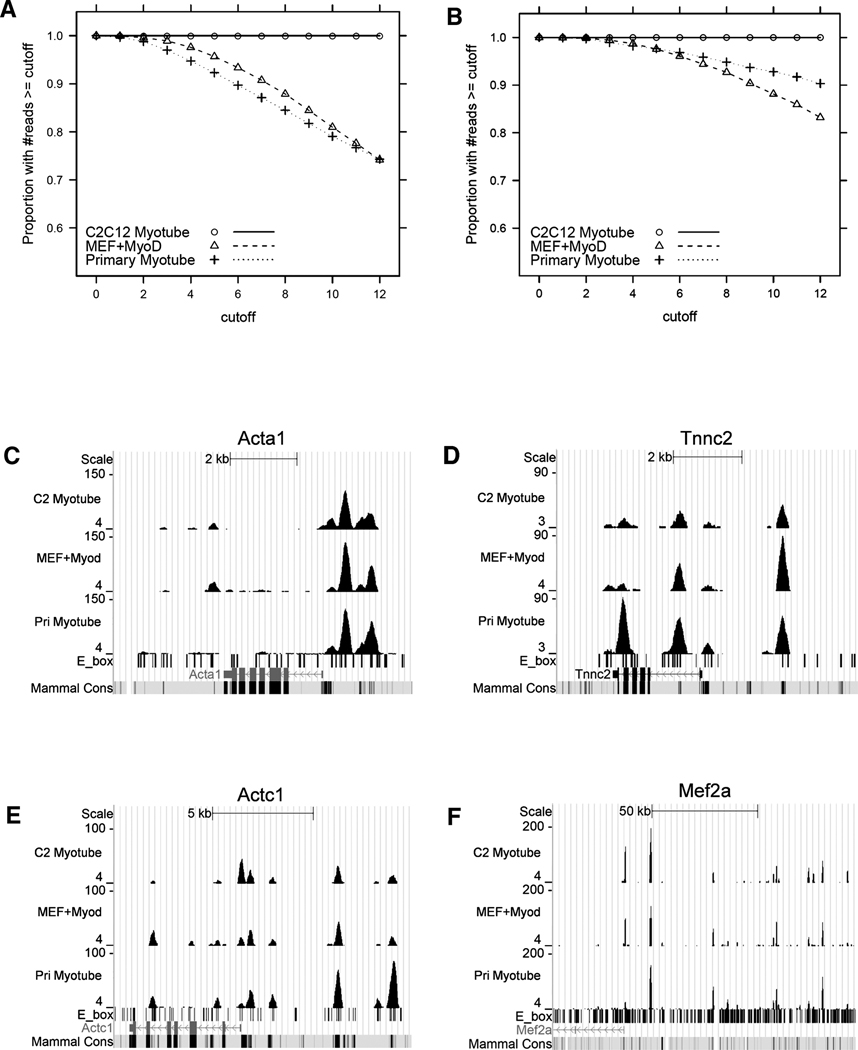
Figure 4.
MyoD binding in primary myotubes and fibroblasts. A) The MyoD binding regions are largely shared between C2C12 Myotubes (open circle) and primary myotubes (open triangle), or mouse embryonic fibroblasts expressing MyoD (cross). To assess the concordance between C2C12 myotubes and the other two types of myotubes, MyoD bound regions in C2C12 myotubes with at least 12 coverage were treated as reference, and the proportion of peaks that were also present in primary myotubes or fibroblasts expressing MyoD at each given cutoff was plotted. B) Plot is similar to A), except that the analysis was restricted to the peaks present in C2C12 myotubes that increased in coverage during differentiation, indicating a high similarity in this set of peaks that are associated with differentially expressed genes (see Fig. 4A). C), D), E) and F) show the MyoD binding profiles at the Acta1, Tnnc2, Actc1 and Mef2a loci.

