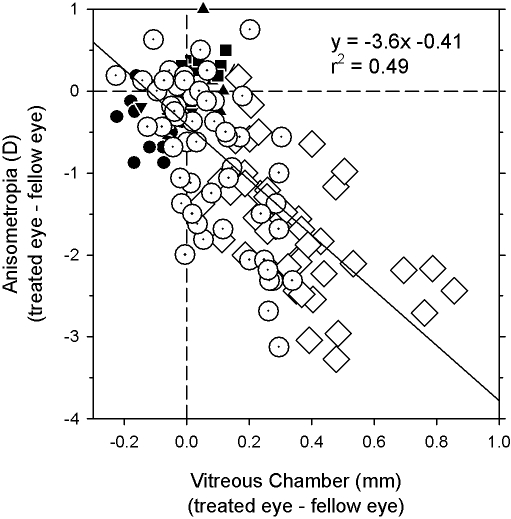
Figure 8.
Interocular differences in refractive error obtained at ages corresponding to the end of the lens-rearing period plotted as a function of interocular differences in vitreous chamber depth (treated or right eye − fellow or left eye). Data are shown for the normal (filled symbols), NF, (open dotted circles), and FF (open diamonds) monkeys for all eccentricities along the horizontal meridian. Solid line: best-fitting regression line.

