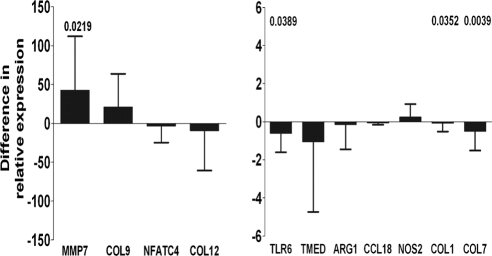
Figure 2.
Median difference (with upper or lower quartile range) in relative expression from total RNA conjunctival samples of 47 cases and 47 controls measured by qRT-PCR with primers specific for each gene. Positive differences indicate an upregulation in disease and negative differences indicate a reduction in expression. Unadjusted significant P-values (P < 0.05), shown above each target gene, were calculated with Wilcoxon-signed rank test. Bars indicate significantly downregulated genes. Bonferroni correction for multiple testing estimates significant values needed to reach 0.05/16 (P < 0.003125).

