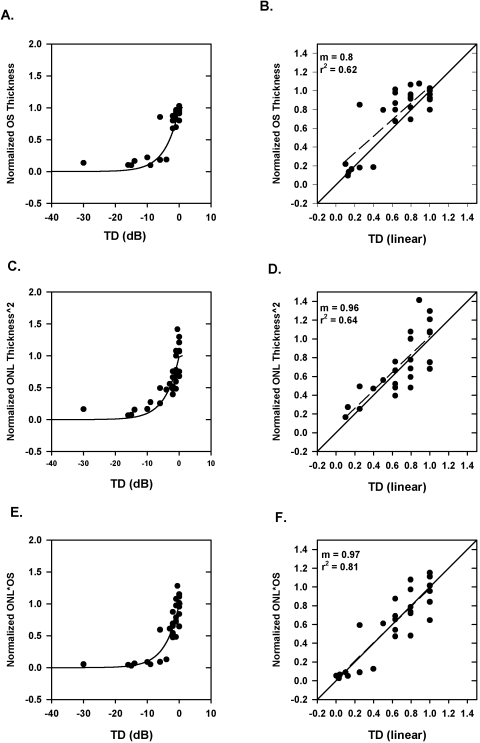
Figure 5.
(A) Plot of normalized OS thickness as a function of TD for all retinal locations along the vertical and horizontal meridians from a single patient. (B) The same data as shown in (A), with the TD expressed in linear units and data are shown only up to −10 dB. (C) Plot of normalized ONL thickness squared as a function of TD for all retinal locations along the vertical and horizontal meridians from a single patient. (D) The same data as shown in (C), with the TD expressed in linear units and data are shown only up to −10 dB. (E) Plot of normalized product of OS thickness and ONL thickness as a function of TD for all retinal locations along the vertical and horizontal meridians from a single patient. (F) The same data as shown in (E), with the TD expressed in linear units; data are shown only up to −10 dB. Solid line: the simple linear model; dashed line: linear regression line for the data in the right panels.

