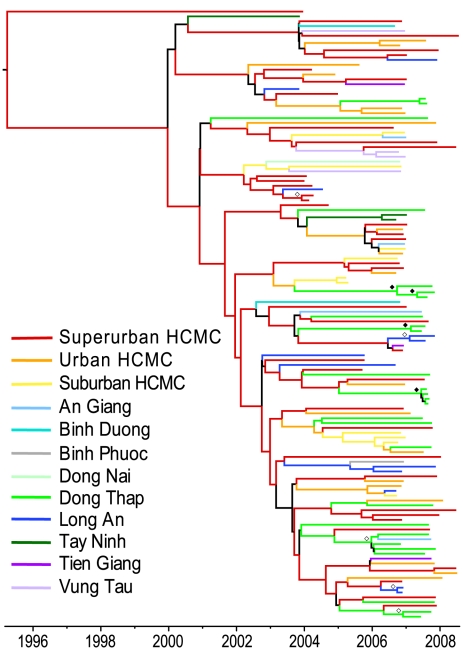
Figure 3. MCC phylogeny of the DENV-2 Asian I genotype in southern Viet Nam (2003–2008) according to population density (within HCMC) or province of sampling.
Tips are colored by urban level (within HCMC) or province of sampling. Internal branches are colored based on the reconstructed ancestral state as estimated by the reversible diffusion model. Branches colored black indicate Bayesian posterior probabilities less than 0.85. Estimated support for the reconstructed ancestral state is indicated by open (>95%) and closed (>85%) diamonds.

