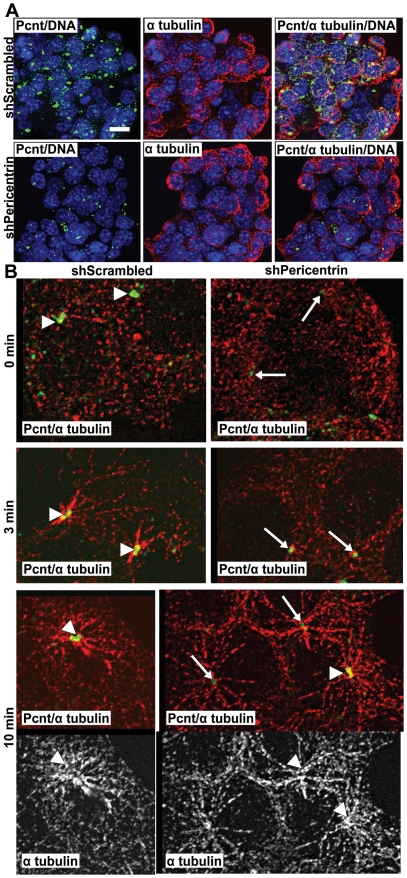
Figure 6. Microtubules are not visibly affected in pericentrin-depleted insulinoma cells.
A. Immunofluorescence staining for pericentrin (green), α tubulin (red) and DNA (blue) in NIT1 cells stably transduced with scrambled or pericentrin shRNAs; scale bar represents 10 µm. B. NIT1 cells were treated with nocodazole (100 µM) for 30 min, and microtubules were allowed to regrow for the indicated times. Arrowheads indicate normal level of pericentrin at the centrosome, arrows indicate depleted pericentrin levels; α tubulin (red or white), pericentrin (green).

