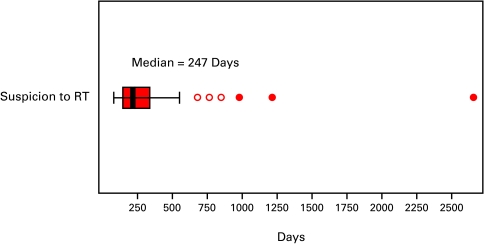
Fig. 2a.
The boxes represent values between the 25th and 75th percentiles; the midline marks the median; the projecting lines represent the most extreme values in the data set that were not more than 1.5 times the width of the box beyond either quartile; open circles represent outliers (1.5–3.0 times the interquartile range) and closed circles represent extremes (>3.0 times the interquartile range). This figure illustrates the overall interval from date of suspicion to date of first radiotherapy fraction for prostate cancer treated with radiotherapy (n = 41).

