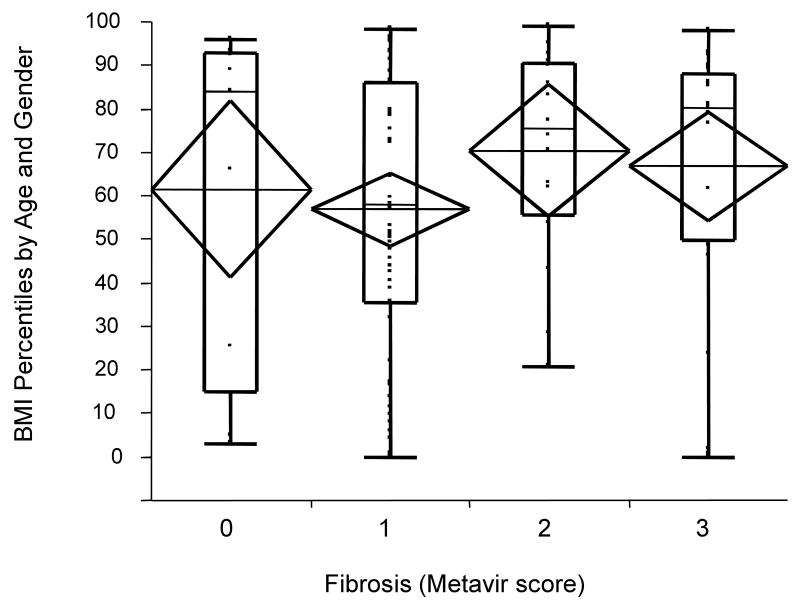
Figure 2.
BMI percentile scores by fibrosis stage. Mean (±SE) BMI percentile scores across the four categories of fibrosis were relatively constant (METAVIR 0 = 61st ± 10.3, METAVIR 1 = 57th ± 4.2, METAVIR 2 = 70th ± 7.7, METAVIR 3-4 = 67th ± 6.3), and not statistically different (F(3,98)=1.1, p =0.36). Diamonds represent 95% confidence intervals around the mean. Box plots represent subject to subject variation (box ends represent 25th to 75th percentiles).

