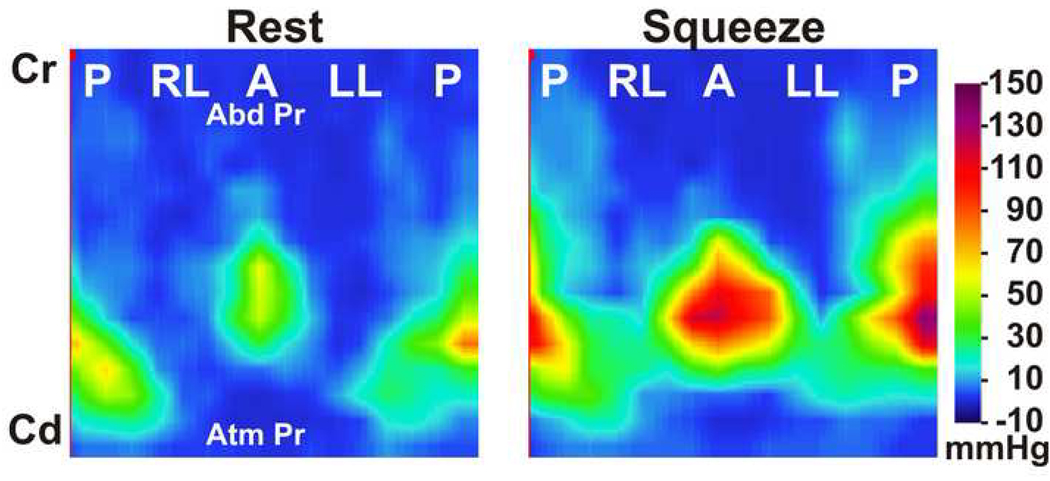
Figure 1.
Color high definition manometry plot of the vaginal pressures at rest and pelvic floor contraction. Plot represents pressures from 256 pressure sensors displayed in a single plane. (P-posterior, RL-right lateral, A-anterior and LL-left lateral, Cr-cranial end, Cd-caudal end). Note the axial and circumferential pressure asymmetry of the vaginal high-pressure zone.

