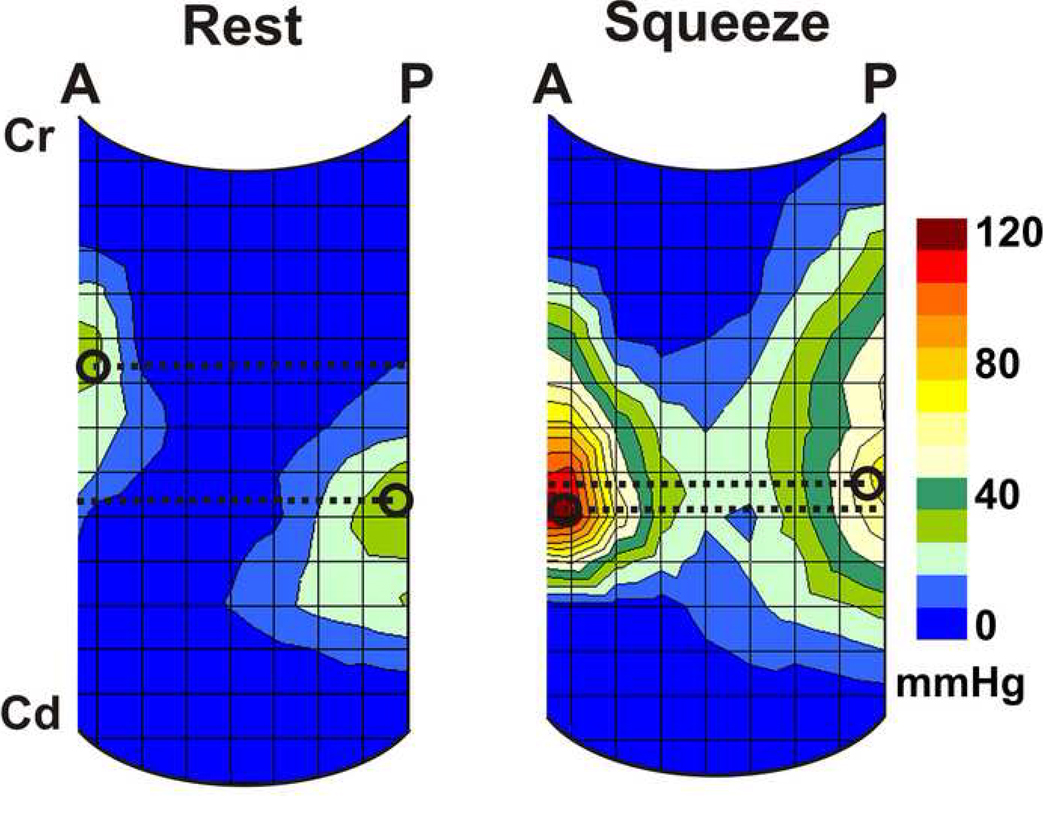
Figure 5.
Sagittal view of the high definition manometry plots at rest and during squeeze demonstrating the location of the peak pressure in the anterior (A) and posterior (P) midline. Black circle marks the location and broken line depicts the level of peak pressures. With pelvic floor contraction the distance (Δ = Delta) between the peak pressures decreases from 1.0 to 0.2 cm. Cr-Cranial end, Cd-Caudal end

