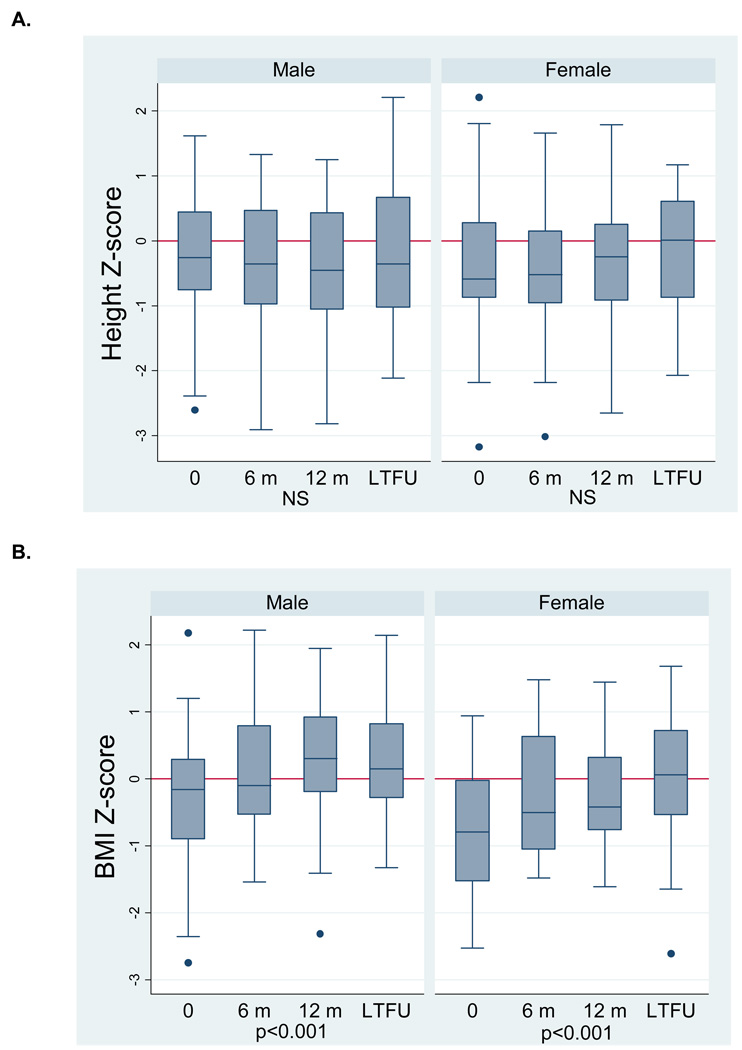
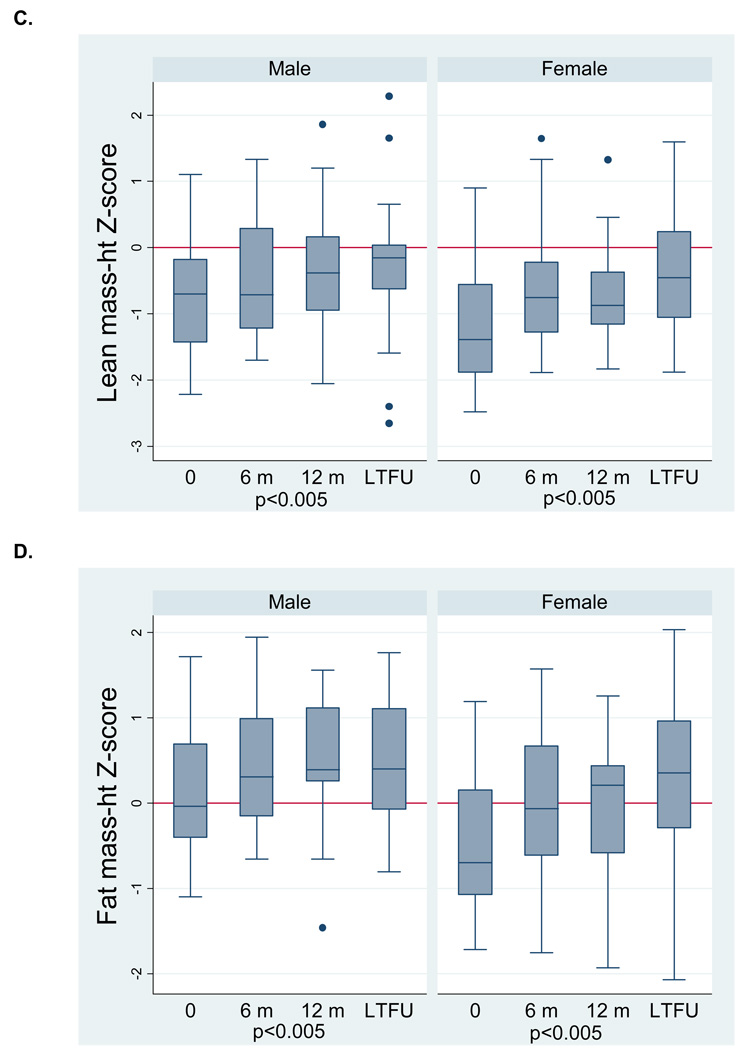
Figure 2.
Anthropometry (A,B) and body composition (C,D) Z-scores following disease diagnosis in incident Crohn’s disease subjects. Data for Figure 2A are limited to the 27 subjects in Tanner stages 1–4 at each study visit. Data for Figure 2B – D are limited to the 46 subjects with data at each study visit. P-values for time and (time)2 are reported jointly to capture the non-linear relations.


