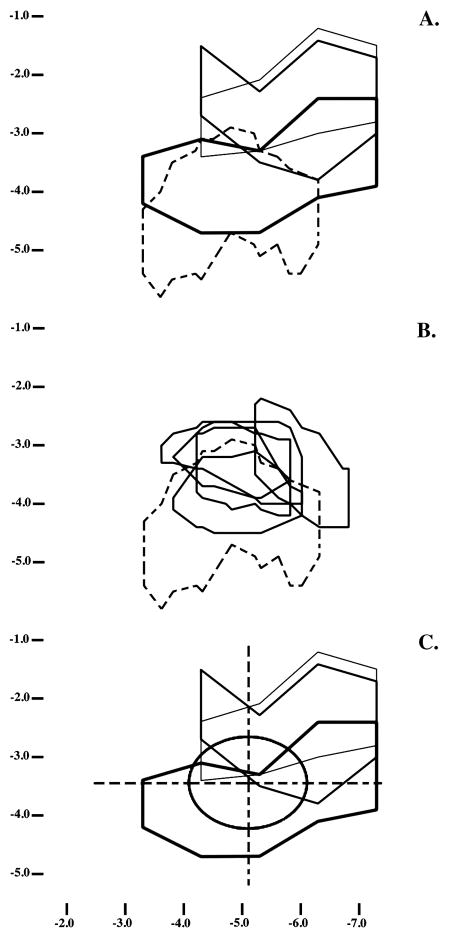
Figure 3.
Each panel shows projections of lesions or A1 maps onto the cortical surface. The vertical axis shows dorsal-ventral coordinates, in mm, relative to the brain’s dorsal surface; the horizontal axis shows anterior-posterior coordinates relative to bregma [39]. In panel A, the representative lesions described in Figure 1 are projected onto the cortical surface, using thin, intermediate and thick lines to depict lesions increasing in total volume. Dashed lines depict the cortical projection of A1, as this area is defined in [39]. Panel B compares A1 as described in [39] (dashed lines) with the boundaries determined in the 5 animals in which this area was mapped electrophysiologically as part of this study (solid lines). In panel C, the lesions from panel A are superimposed on the average location and extent of physiologically-defined A1 (oval). The grid overlaying A1 was used in some analyses to define areas of damage within and immediately adjacent to A1.

