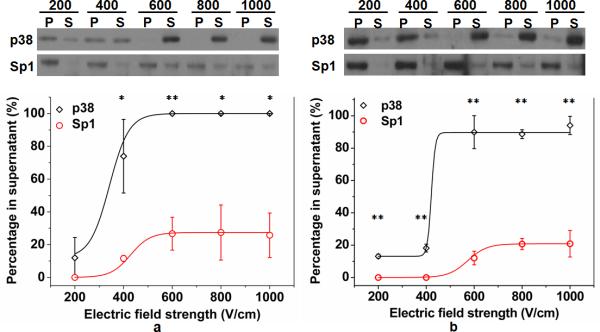
Figure 2.
Intracellular protein release under different electroporation conditions. The levels of p38 and Sp1 in supernatant (S) and pellet (P) fractions from DT40 B cells electroporated at different field strengths (200, 400, 600, 800, 1000 V/cm) for 100 (a) or 50 (b) ms was analyzed by Western blotting (upper panels). The percentage of p38 and Sp1 in the supernatant fraction (calculated based on three trials of Western blot analysis) at different field strengths for electroporation of 100 (a) and 50 (b) ms is shown in the lower panels. The difference between the two data points is statistically significant with P values less than 0.05 (*) and 0.01 (**).

