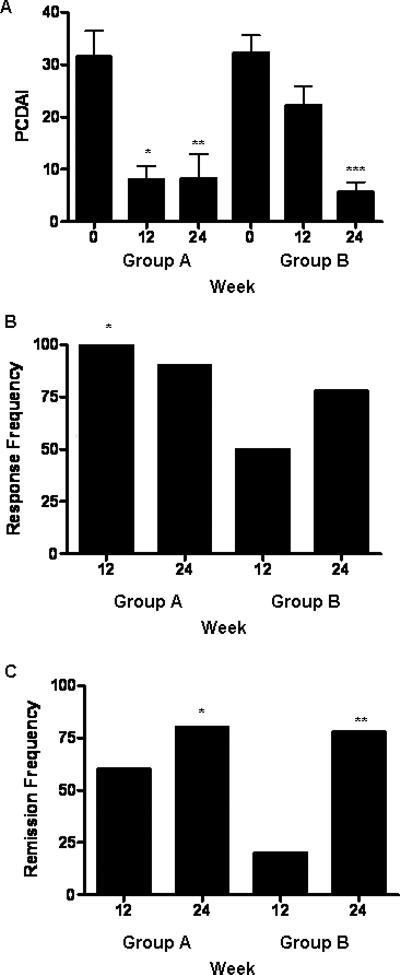
Figure 3. Clinical Disease Activity.

Clinical disease activity was determined at the time points shown using the Pediatric Crohn's Disease Activity Index (PCDAI). A) The mean(SEM) PCDAI is shown. *p= 0.0004 vs. group A at baseline, **p= 0.003 vs. group A at baseline, ***p= 0.002 vs. group B at week 12. The frequency of B) response (decrease in PCDAI ≥ 15) and C) remission (PCDAI ≤ 10) is shown. B) *p= 0.02 for group A at week 12 vs. group B at week 12 by Fisher's Exact test. C) *p= 0.01 for group A at week 24 and **p= 0.02 for group B at week 24 vs. group B at week 12 by Fisher's Exact test. n=10 in each group except for n=9 in groups A and B at week 24.
