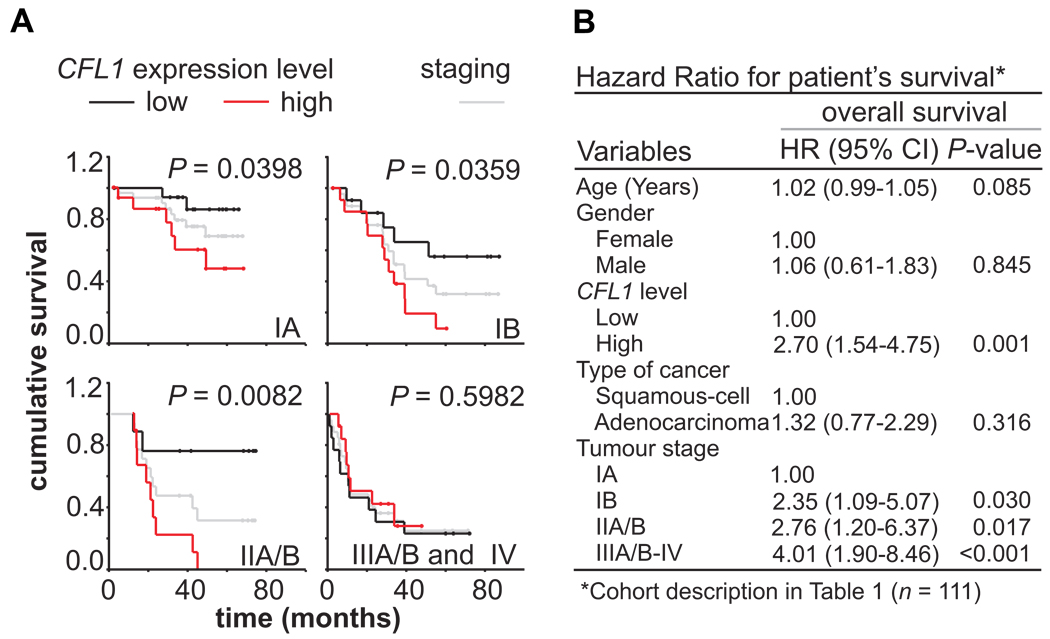
FIGURE 1. Prognostic value of CFL1 mRNA levels in NSCLC patients.
(A) Meta-analysis of cohort data grouped according to the International Staging System for Lung Cancer and CFL1 gene expression level (i.e. upper-fifth vs. lower-fifth), and plotted as survival probabilities using Kaplan-Meier method. Black lines represent patients with low CFL1 expression; red lines with high CFL1 expression. Differences in survival rates were assessed with the log-rank test. Gray lines represent all patients according to tumor staging. P values lower than 0.05 were considered significant. (B) Cox multivariable regression analysis to estimate hazard ratios for cohort clinical covariates and CFL1 expression. Hazard ratios indicate that patients with high CFL1 expression level presented poor outcome.

