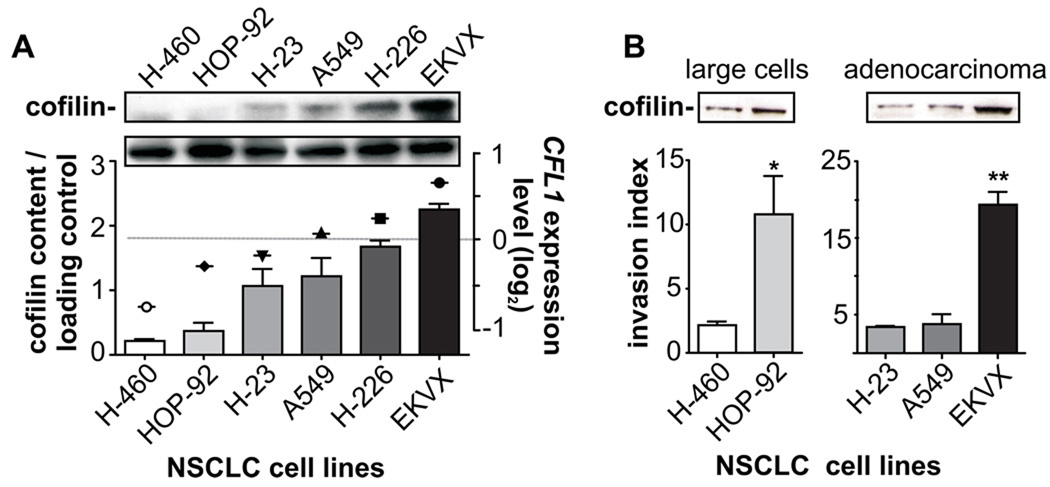
FIGURE 3. Cofilin immunocontent correlates with tumor invasiveness and resistance against alkylating drugs.
Six human NSCLC cell lines composed of adenocarcinomas (H-23, A549, EKVX), large cells (H-460, HOP-92) and squamous-cells carcinomas (H-226) from the NCI-60 panel were selected based on different levels of CFL1 gene expression (http://discover.nci.nih.gov/datasetsNature2000.jsp) to establish the role of CFL1 in tumor aggressiveness, evaluated by assays of cell invasion and drug resistance. (A) Western blot analysis shows that the pattern of CFL1 mRNA (symbols) matches with the level of cofilin immunocontent (bars). (B) Invasion index was obtained by determining the movement of cells through an 8.0 µm pore size, either uncoated (migration) or matrigel-coated (invasion), attracted by a chemotactic gradient of serum. The mean of four fields for each condition in quadruplicates is plotted. *P < 0.02 (Mann Whitney test); **P < 0.0001 (One-way ANOVA).

