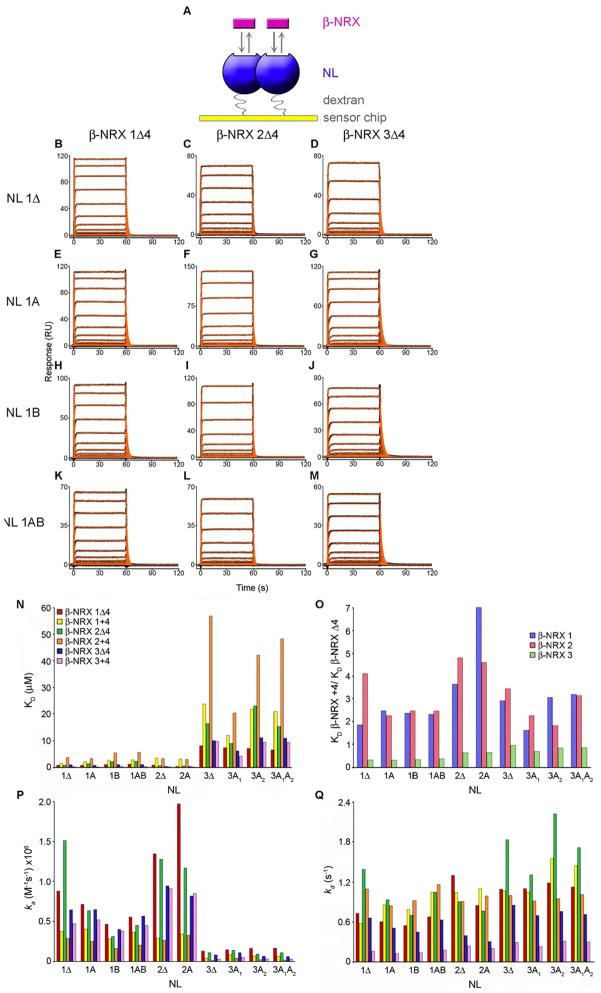
Figure 2. SPR binding analysis of β-NRXs 1–3 splice variants to NLs 1–3 isoforms.
(A) In the SPR binding assay, NL was immobilized to the sensor chip surface (ligand) and increasing concentrations of β-NRX were injected in the solution phase (analyte). Two molecules of β-NRX bind to each dimeric NL. (B–M) β-NRXΔ4 isoforms binding over sensor chip surfaces immobilized with NL isoforms 1Δ, 1A, 1B and 1AB at a concentration range of 8.0-0.039 μM with the exception of panels B and C, where the highest concentration tested was 4 μM. Black traces show the experimental data and red traces show the fit to a 1:1 model with a step to account for mass transport. The KDs, along with fold change analyses, are listed in Tables 1, S2-S3, and the kinetic rates are shown in Table S1. (N) KD values determined by SPR binding analysis for the interaction of the two isoforms of each β-NRX 1, 2 and 3, with the ten different NL isoforms, containing or lacking splice inserts A and for NL1 splice insert B. The values for this plot are listed in Table 1. (O) The KD values of β-NRX+4 interacting with a given NL, normalized against the KDs of the same NL binding to β-NRXΔ4. The fold changes for each β-NRX+4 binding to a certain NL compared to the binding of β-NRXΔ4 are shown in Table S2. (P) A plot of the association rates (ka) and (Q) a plot of the dissociation rates (kd) for β-NRX/NL interactions. The values in this plot are shown in Table S1. The association and dissociation rates were used to calculate the KDs in (N) using the relationship KD=kd/ka.

