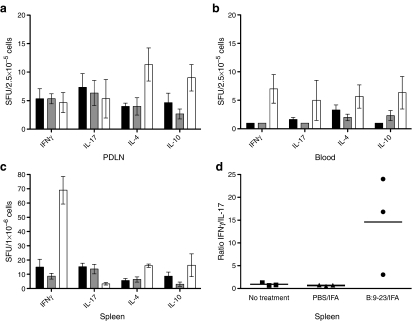
Fig. 4.
Insulin B:9-23/IFA treatment induces IFNγ/IL-4 production in the spleen and IL-10/IL-4 in the PDLN. In B:9-23/IFA immunised mice (white bars), laboratory measurements showed an increase in IL-10 (p < 0.05) and IL-4 (p < 0.05) cytokine-producing cell numbers in the PDLN (a), in IFNγ in the blood (p < 0.05) (b), and in IFNγ and IL-4 in the spleen (p < 0.01 and p < 0.05 respectively) (c) vs no treatment (black bars) and PBS/IFA treatement (grey bars). In the spleen (d), the IFNγ:IL-17 ratio was increased more than tenfold (p < 0.01) The number of B:9-23-reactive CD4+ T cells producing IFNγ, IL-17, IL-4 and IL-10 in all secondary lymphoid organs analysed was calculated by deducting the number of spot-forming units (SFU) without stimulation from the number of SFU after B:9-23 re-stimulation. In each condition, 50 U/ml of rhIL-2 was added to the culture, which lasted for 3 days. In the spleen, Elispot using CD8-depleted lymphocytes was performed, whereas in the blood and PDLN, T cell-depleted splenocytes from age-matched non-treated NOD mice were added as APCs. The numbers of SFU without stimulation (background), which were subtracted to generate the experimental results for IFNγ, IL-17, IL-4 and IL-10, were: for spleen 80 ± 20, 150 ± 45, 115 ± 30 and 25 ± 15; for PDLN 43 ± 13, 75 ± 25, 48 ± 12 and 45 ± 15; and for blood: 35 ± 12, 75 ± 15, 60 ± 25 and 6 ± 5 respectively. The analysis shown is from 12-week-old immunised or non-treated NOD animals; similar results were obtained from two independent experiments with three mice per group. One representative experiment is shown

