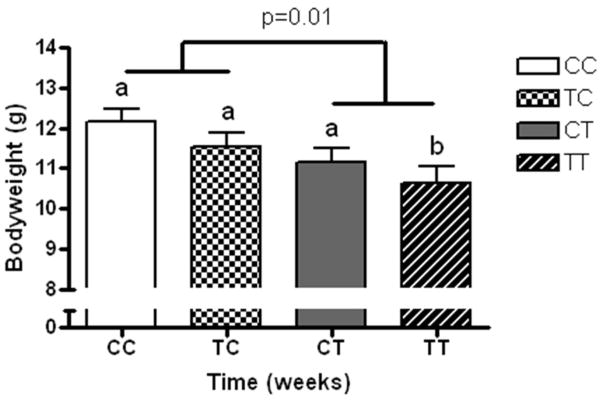
Figure 3.
Body composition of offspring at weaning as measured by computed tomography and calculation of abdominal fat volume and converted to a weight/weight basis for each individual. Data shown represents means ± SEM of the groups, defined as CIS diets during in utero and through breastfeeding during neonatal growth periods (CC; white bar), TRANS diet in utero and CIS diet during breastfeeding (TC; checked bar), CIS diet in utero and TRANS diet during breastfeeding (CT; grey bar) and TRANS diet during in utero and breastfeeding growth periods (TT; diagonal striped bar). Two-way ANOVA analysis of diet exposure at each developmental stage was conducted and different letter superscripts denote statistical differences at α < 0.05 (n=10–18/group). A main effect of diet during lactation (CIS vs. TRANS) is present with TRANS exposure reducing adiposity.

