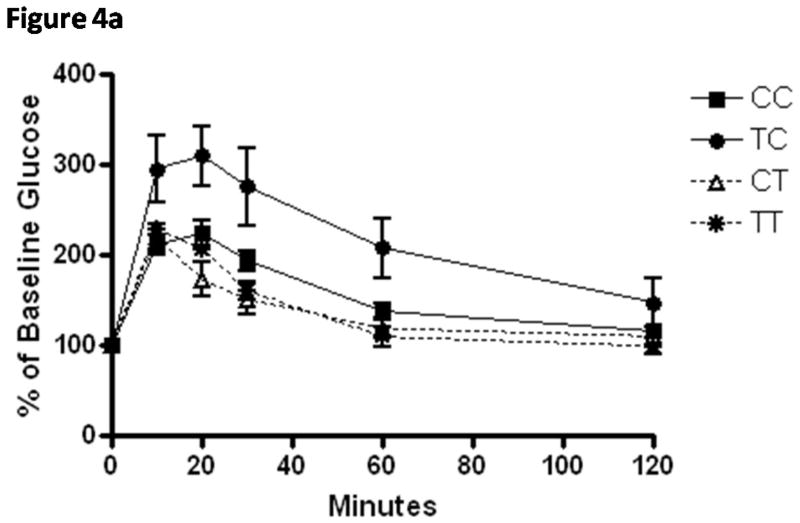
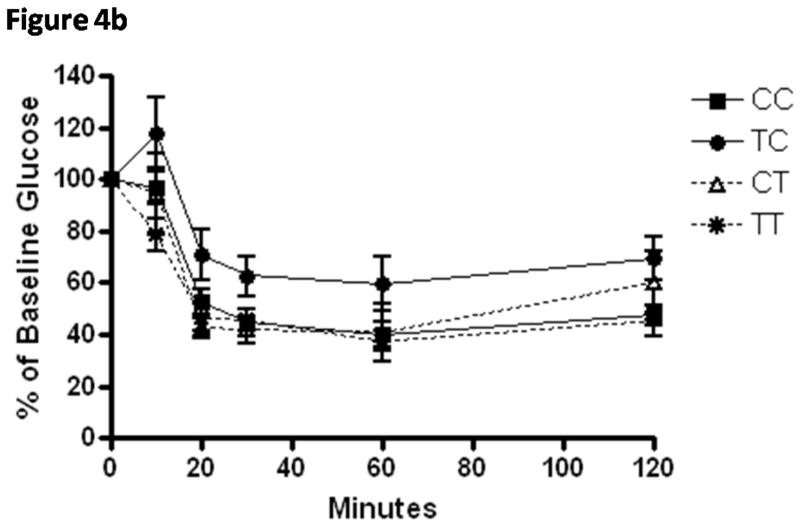
Figure 4.
A) Means ± SEM normalized glucose values from glucose tolerance testing of weanling mice (n=8–14/group) exposed to CIS diets during in utero and through breastfeeding during neonatal growth periods (CC; white bar), TRANS diet in utero and CIS diet during breastfeeding (TC; checked bar), CIS diet in utero and TRANS diet during breastfeeding (CT; grey bar) and TRANS diet during in utero and breastfeeding growth periods (TT; diagonal striped bar). The TC group demonstrates glucose intolerance and area under the curve calculated from this data series was significantly higher than all other groups (see Table 5).
B) Means ± SEM normalized glucose values from insulin tolerance testing of weanling mice (n=6–11/group) from these same groups demonstrating further evidence that TC mice were significantly more insulin resistant (see Table 5) as determined by calculated areas under the curve.


