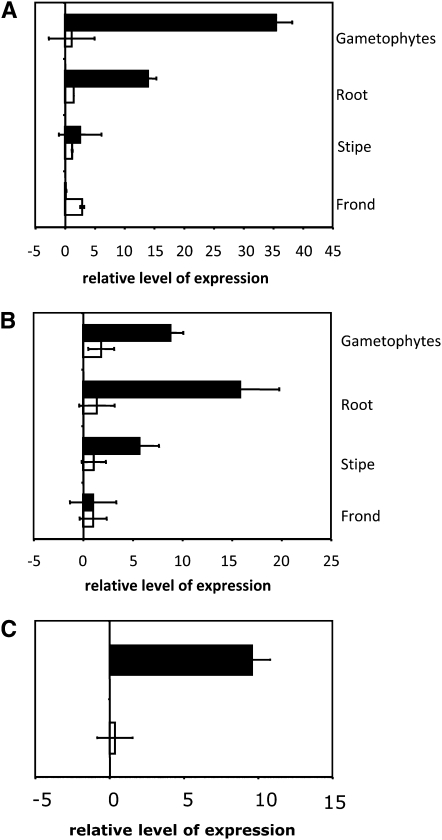
Figure 4.
Expression of ACR3 and ACR3;1 in P. vittata Gametophytes and Sporophyte Tissues as Determined by qRT-PCR.
(A) Each bar indicates the fold change in the expression of ACR3 (black bars) or ACR3;1 (white bars) in various tissues of plants grown in 10 mM arsenate relative to plants grown in the absence of arsenic.
(B) The difference in expression of ACR3 (black bars) or ACR3;1 (white bars) in various tissues of plants grown in the presence of 10 mM arsenate relative to their expression in the fronds of arsenate-grown plants.
(C) The fold change in the expression of ACR3 (black bars) or ACR3;1 (white bars) in gametophytes grown in 0.5 mM arsenite relative to gametophytes grown in the absence of arsenite.
For (A) to (C), three technical replicates of three biological replicates per treatment were performed. Error bars represent the range around the mean calculated as a composite sd from the P. vittata histone gene and ACR3.

