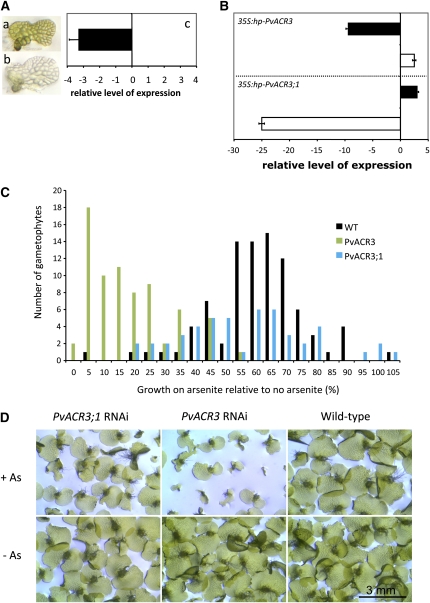
Figure 6.
Development and Use of RNAi to Determine the Effects of Knocking Down the Expression of ACR3 and ACR3;1 in P. vittata Gametophytes.
(A) Knocking down the expression of the P. vittata MgChI gene in gametophytes by RNAi results in a colorless phenotype. (a) Wild-type P. vittata gametophyte. (b) Gametophyte bombarded with 35S:antisense-PvChlI 6 d after bombardment. (c) Relative level of MgChI expression in pools of colorless gametophytes relative to expression in green wild-type gametophytes (n = 3) as determined by qRT-PCR.
(B) Relative levels of ACR3 and ACR3;1 expression in wild-type and RNAi gametophytes as determined by qRT-PCR. Relative change in ACR3 (solid bar) and ACR3;1 (white bar) expression in ACR3-RNAi gametophytes (top panel) and ACR3;1 RNAi gametophytes (bottom panel) relative to similarly treated wild-type gametophytes (relative change = 2ΔΔCT; ΔΔCT = ΔCT RNAi gametophytes − ΔCT wild-type gametophytes). All gametophytes were grown in the presence of arsenite.
(C) The tolerance of gametophytes to arsenite was measured as the change in growth of the prothallus. Wild-type (WT) gametophytes are indicated by black bars (n = 88 individual gametophytes with As and n = 96 without As), ACR3 RNAi gametophytes by green bars (n = 73 individual gametophytes with As and n = 72 without As), and ACR3;1 RNAi gametophytes by blue bars (n = 50 individual gametophytes with As and n = 71 without As).
(D) Phenotypes of gametophytes 12 d after transfer to no or 0.5 mM arsenite. The top panels show the gametophytes on 0.5mM arsenite, and the bottom panels show the gametophytes on no arsenite. The genotypes of the gametophytes are labeled above the panels.
Error bars in (A) and (B) represent the range around the mean calculated as a composite sd from the P. vittata histone gene and ACR3.

