Figure 3.
ORR Gene Expression and Protein Subcellular Localization.
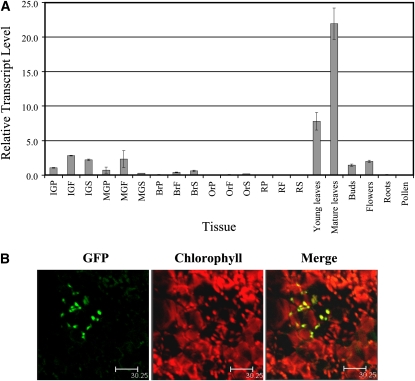
(A) Expression of ORR in various plant tissues (cv MicroTom) detected by qRT-PCR. Peel (P), flesh (F), and seeds (S) were dissected from IG (immature green), MG (mature green), Br (breaker), Or (orange), and R (red) fruit. Expression data were normalized to the expression of the ASR1 gene, and values are means ± se (n = 3).
(B) The subcellular localization of ORR (starting from AUG-I) was investigated using confocal microscopy after transient expression of ORR-GFP fusions in tobacco leaves. The natural chlorophyll red fluorescence signal was used to visualize chloroplasts and was merged with the GFP signal. The pattern of ORR-GFP starting from AUG-I coincided with that of chlorophyll confirming its chloroplast localization. Bars = 30.25 μm.

