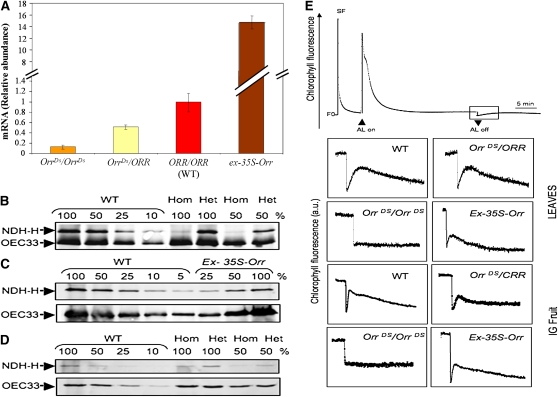
Figure 4.
ORR Gene Expression and Activity and Levels of the Ndh Complex in the OrrDs Mutants.
(A) Expression of ORR in immature green fruit (30 d after anthesis) of the wild type (WT) and OrrDs mutants. qRT-PCR expression data were normalized to the expression of the ASR1 gene and presented as percentage of the wild type, which was set at 100% (values are means ± se; n = 3). Asterisk indicates values that are significantly different from the wild type (P < 0.01). The amplified part is located in the coding region downstream of the insertion.
(B) to (D) Protein gel blot analysis. Thylakoids were extracted from wild-type, homozygous (Hom; OrrDs/OrrDs), heterozygous (Het; OrrDs/ORR), and the ex-35S-Orr mutants leaves and immature green fruit. Proteins were separated by SDS-PAGE, transferred onto nitrocellulose membrane, and analyzed using anti-NDH-H antibodies. The lanes were loaded with samples corresponding to 15 μg of chlorophyll (100%) and a series of dilutions as indicated. Immunodetection of OEC33 was used as a loading control.
(E) In vivo detection of Ndh complex activity by chlorophyll fluorescence measurements. Leaf and immature green fruits chlorophyll fluorescence of wild-type and mutant tomato plants was monitored with a PAM fluorometer. The top curve is a typical trace of chlorophyll fluorescence in the wild type. After a 5-min actinic illumination (AL; 250 μmol photons m−2 s−1), Fs levels reached similar levels in wild-type and mutant leaves. After switching the light off (AL off), transient increases in chlorophyll fluorescence were recorded under low nonactinic light. Insets are magnified traces from the boxed area. SF, saturating flash of white light.
[See online article for color version of this figure.]

