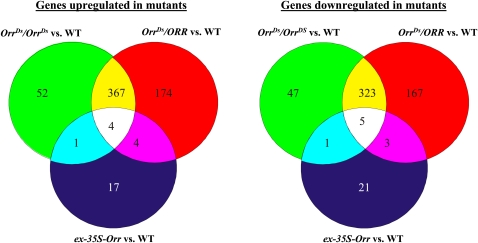
Figure 6.
Gene Expression Changes in the OrrDs Mutants.
Venn diagrams of genes changed in expression in fruit (breaker stage) of the three OrrDs genotypes compared with the wild type (WT). The Venn diagrams show significantly up- and downregulated genes in fruit of the OrrDs/ORR (red), OrrDs/OrrDs (green) and the ex-35S-Orr (blue) lines when compared with the wild type. Genes being significantly up- or downregulated in several of the genotypes are shown in the respective overlap regions.
[See online article for color version of this figure.]

