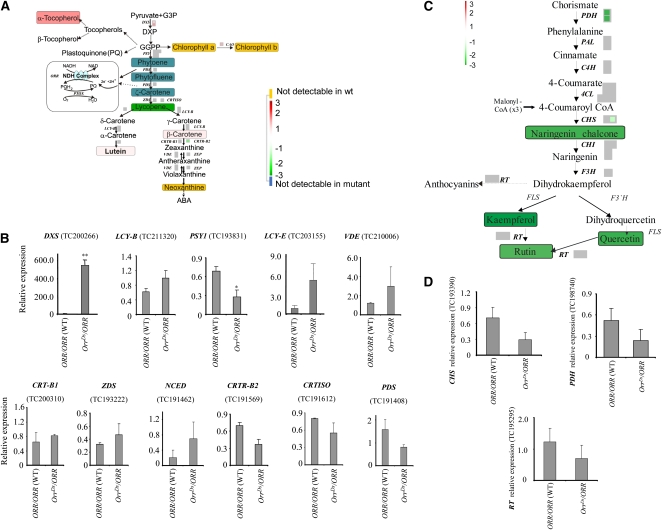
Figure 7.
The Effect of the OrrDs Mutation on Gene Expression in the Isoprenoid and Phenylpropanoid/Flavonoid Biosynthesis Pathways.
(A) Representation of gene expression and metabolite levels changes in fruit derived from the OrrDs/ORR genotype compared with that of wild-type plants. Microarray probe sets reporting the gene expression of likely pathway genes are depicted by color-coded boxes indicating the log2 fold change of the respective transcripts according to a false-color scale reproduced in the figure, where white represents no change, red an upregulation, and green a downregulation. Each individual box represents a unique probe set present on the chip hybridizing to isoforms of the respective gene indicated next to it. Nonsignificantly changed probe sets are depicted in gray. Metabolites where quantitative data were available are represented as black text on colored boxes, where the box color indicates log2 fold changes following the same color scheme as transcripts. Metabolites not detectable in the mutant are painted on a blue box, whereas the ones not detectable in the wild type are painted on a yellow box. The electron transport pathway involving the Ndh complex and PTOX (adapted from Carol and Kuntz, 2001) is represented in a box on the left. GGPP, geranylgeranylpyrophosphate; DXP, 1-deoxy-d-xylulose 5-phosphate; DXS, 1-deoxy-d-xylulose 5-phosphate synthase; PSY, phytoene synthase; CrtISO, carotene isomerase; CRTL-E, LCY-E, lycopene e-cyclase; LCY-B, lycopene β-cyclase; ZEP, zeaxanthin epoxidase; VDE, violaxanthin de-epoxidase; CAO, chlorophyll a oxidase.
(B) Expression of genes in the isoprenoid pathway (including carotenoid-related) in the hetrozygous OrrDs mutant and wild-type breaker stage fruit as detected by qRT-PCR. Full names of genes are given in (C). Expression data were normalized to the expression of the CLATHRIN ADAPTOR COMPLEXES SUBUNIT (CAC) gene; values are means ± se (n = 3). Asterisks indicate values that are significantly different from the wild type at *P < 0.05 and **P < 0.01.
(C) Representation of gene expression and metabolite levels changes in fruit derived from the OrrDs/ORR genotype compared with wild-type plants. The array and metabolite analysis data are presented in the same way as in Figure 7A. PAL, Phe-ammonia lyase; 4CL, 4-coumaroyl-CoA synthase 2; CHS, chalcone synthase; CHI, chalcone isomerase; F3H, flavanone 3-hydroxylase; FLS, flavonol synthase; 3GT, anthocyanidin 3-O-glucosyltransferase; RT, rhamnosyltransferase; CAD, cinnamyl-alcohol dehydrogenase; F3′5'H, flavanone 3′, 5′hydroxylase.
(D) Expression of genes related with phenylpropanoids/flavonoids pathway in the hetrozygous OrrDs mutant and wild-type breaker stage fruit as detected by qRT-PCR. Full names of genes are given in (B). Expression data were normalized to the expression of the CAC gene; values are means ± se (n = 3).

