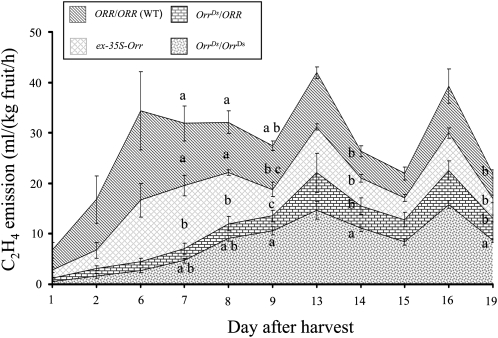
Figure 8.
Ethylene Emission from the OrrDs Mutants and Wild-Type Fruit.
The chart shows ethylene emission from fruit of the OrrDs genotypes and the wild type (WT) measured 11 times during 19 d after the mature green fruit stage. Emission of each line is represented by the patterned strip between two graphs or between the graph and x axis (in the case of the OrrDs/OrrDs genotype). The letters a to c represent significance groups of ethylene emission per day (n = 3; P < 0.05; Student's t test).

