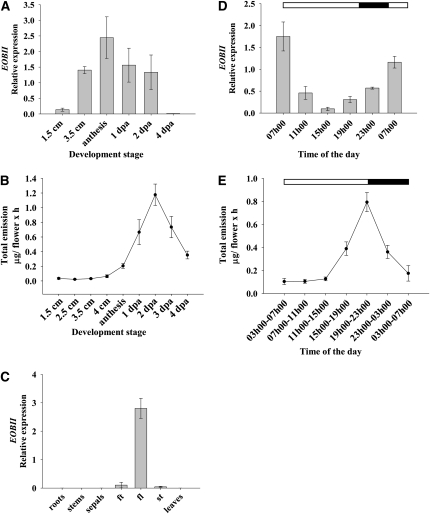
Figure 4.
Spatial, Temporal, and Developmental Regulation of EOBII Transcript Levels and Scent Emission in Petunia Corollas.
The RNA was extracted from corollas at different development stages (A), from different organs (C), and from corollas at different time points during the day/night (D). EOBII transcript levels were determined by quantitative real-time PCR analysis using Actin as the reference. Graphs represent the average of three independent experiments, with standard errors indicated by vertical lines. ft, flower tube; fl, flower limb; st, stamen. Dynamic headspace analyses, followed by GC-MS, were performed (from 17 h00 to 09 h00) with flowers at different development stages (B) and with flowers (2 dpa) at different time points throughout the day/night (E). Black part of horizontal bar indicates nighttime hours. Each time point represents the average of three to five independent experiments, with standard errors indicated by vertical lines.

