Figure 8.
Interrelationship Between EOBII and ODO1.
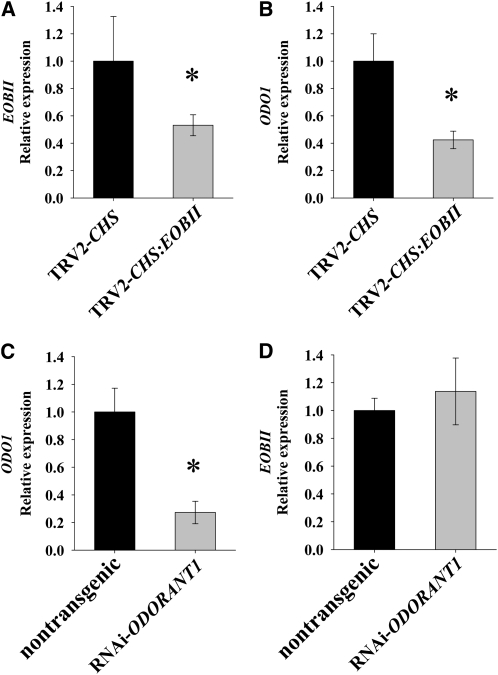
(A) and (B) EOBII silencing leads to downregulation of ODO1 expression. Quantitative real-time PCR analysis of EOBII (A) and ODO1 (B) transcript levels in EOBII-silenced petunia corollas compared with corollas infected with TRV2-CHS. Samples were collected from corollas 1 dpa at 21 h00.
(C) and (D) EOBII transcript level is not affected by downregulation of ODO1. Quantitative real-time PCR analysis of ODO1 (C) and EOBII (D) transcript levels in corollas of ODO1-RNAi–suppressed petunia plants (W115) compared with those in control nontransgenic plants. Samples were collected from corollas 1 dpa at 07 h00. Presented data were normalized to control corollas, with standard errors indicated by vertical lines. Significance of differences (P ≤ 0.05; n = 6) between treatments (asterisks) was calculated (Student's t test) based on the raw transcript levels' data normalized to Actin.

