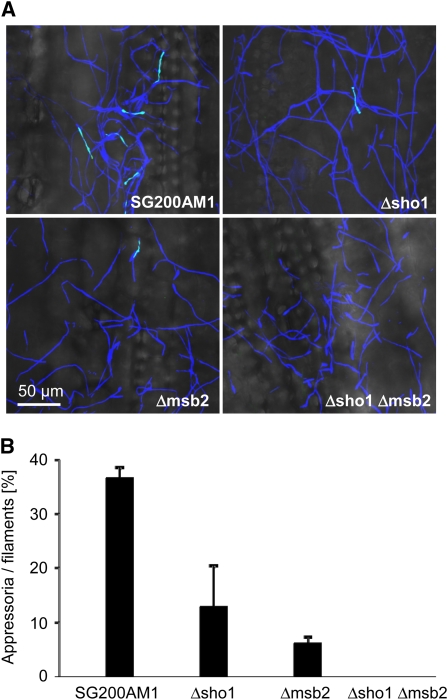
Figure 4.
Sho1 and Msb2 Affect Appressorium Formation on the Plant Surface.
(A) Maize seedlings were infected with SG200AM1 and its derivatives as indicated. Eighteen hours after infection, the surface of the third oldest leaf was analyzed by confocal microscopy. Fungal hyphae were stained by calcofluor (blue), and expression of the AM1 marker (green) indicates appressorium formation. The overlays of maximum projections of both channels with the corresponding bright-field images are depicted.
(B) Quantification of appressoria on the plant surface. Using the same strains as in (A), the average percentage of filaments that had formed appressoria to the total number of filaments was determined. For each strain (indicated below each column), >900 filaments were analyzed in three independent experiments. Error bars indicate standard deviations.

